What the Five Scores Mean
Every strategy in AlgoChef gets five scores, each from 0 to 100. Before you import your own data, learn to read them — they're the center of every screen in the app.
The five, in one breath
| Score | The question it answers |
|---|---|
| Profitability | Does it have a real, repeatable profit edge? |
| Risk | How survivable are its losses? |
| Confidence | Is there enough consistent evidence to trust these results? |
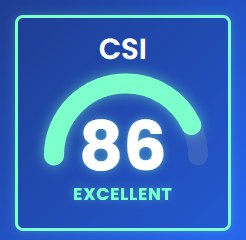
| CSI | The bottom line — AlgoChef's overall quality verdict |
| Health | Is the strategy still behaving the way it used to? |
Think of the first four as a job interview (is this strategy worth hiring?) and Health as the performance review (is it still doing its job?).
Read them in this order
- CSI first. It's the single number that gives AlgoChef's overall quality verdict. A strategy can't buy a good CSI with returns alone — that's by design.
- Health second. A great CSI on a strategy that's actively degrading is a trap. Health compares recent behavior against the strategy's own earlier baseline.
- Then Profitability, Risk, and Confidence. If CSI is lower than you expected, these related scores often show where the strategy is struggling.
The tiers
All scores share the same color language:
- Excellent (80–100) — top-tier; hard to reach on purpose
- Good (60–79) — solid, with room to improve
- Caution (40–59) — needs attention before real capital
- Failed (1–39) — does not meet the quality bar
A 0 isn't a Failed score — it means the score hasn't been calculated, usually because there aren't enough trades yet. It shows as Not enough data in gray.
Health adds a fifth tier, Critical (30–39), for strategies showing active degradation; Health's Failed tier is 1–29.
Info
A 55 is not an insult. Most honest backtests land in Caution somewhere. The tiers exist to direct your attention, not to pass final judgment — a Caution Confidence score often just means "not enough evidence yet."
Circuit breakers: when a score is forced to Failed
Sometimes you'll see a CSI that seems "stuck" low. That's usually a circuit breaker — a hard safety rule that forces a Failed verdict when something disqualifying shows up: an excessive drawdown, no real edge, an unrealistic win rate, or results that look too good to be true (implausibly high returns or risk-adjusted returns, or an equity curve too smooth to be real). The Quality Report flags exactly which breaker fired, so you always know why a score is what it is.
A strategy that's brilliant in some ways and broken in another is still broken.
Common beginner questions
Why is my score low when my metrics look fine? Because single metrics lie by omission. Great net profit on a short trade history doesn't yet have the evidence behind it. A great Sharpe with a deep drawdown still has a survivability problem. The CSI deep dive covers this in detail.
Can two strategies have the same CSI but be very different? Yes. Same verdict, different strengths and weaknesses, different fixes — the Profitability, Risk, Confidence, and Health scores and the Quality Report show the differences.
Do the scores tell me how much to trade? No. Scores describe validation quality; position sizing is a capital question — that's what Monte Carlo Capital Sizing and Portfolio Studio's Robustness tab are for.
Go deeper (optional)
Each score has its own reference page: CSI · Profitability · Risk · Confidence · Health
Next lesson
Time to get your own data in: Importing Your First Strategy →