Portfolio Studio
Portfolio Studio is the workspace for a single saved portfolio. Where the Portfolios Hub is about building portfolios, the Studio is about understanding and preparing one: what it does, how its capital should be split, and whether it can survive the real world.
Where to find it: In the app sidebar, open Portfolio Studio — it opens your most recent portfolio (or pick one from the Library). The Studio has three main tabs:
| Tab | Question it answers |
|---|---|
| Analyze | What does this portfolio actually do? |
| Allocate | How should capital be split across its strategies? |
| Robustness | Can it survive stress, and how much capital does it need? |
Every portfolio also earns a portfolio-level CSI — the same 0–100 scale as individual strategies, so you can directly compare a portfolio to the strategies inside it.
Analyze Tab
The default landing tab. It reads top-to-bottom like a briefing:
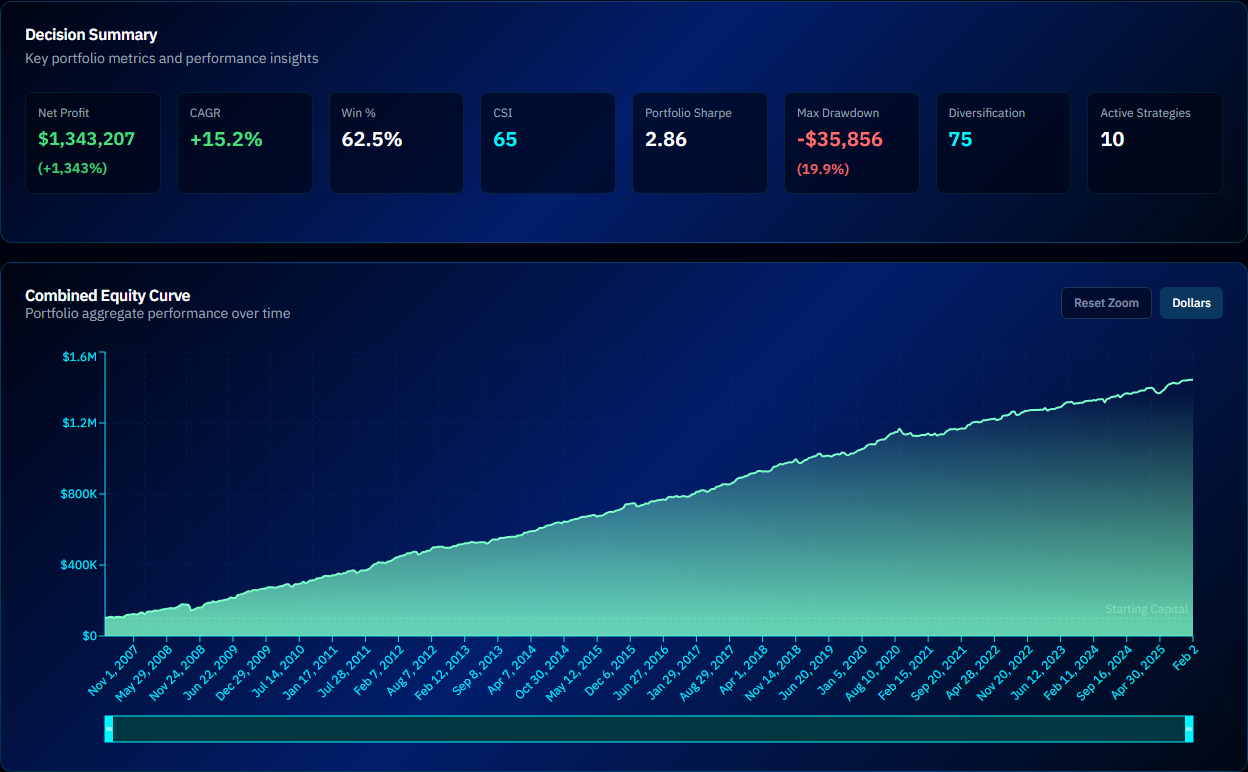
Decision Summary
A row of chips at the top gives the headline verdict — key stats and any warnings that deserve attention. An Edit Portfolio button lets you adjust the composition without leaving the page.
Combined Equity Curve
The portfolio's merged equity curve with a $ / % toggle and brush zoom for inspecting specific periods. This is the curve that matters — individual strategy curves can look ragged while the combination is smooth (that's diversification working).
Contracts Open Over Time
A stacked bar chart of how many contracts each strategy holds through time. Reveals concentration moments — periods when many strategies are positioned at once and your margin and risk usage spikes.
Drawdown Analysis
Portfolio-level drawdown depth and duration, following the same $/% mode as the equity chart. Compare it against the worst member strategy's drawdown to see how much diversification is saving you.
Strategy Allocation
How capital and risk are distributed across members. A sortable allocation table is always shown, with a Bars / Treemap toggle beneath it and a $ / % switch for the figures.
Period Performance & Calendar Returns
Performance sliced by period, plus a month-by-year heatmap — the portfolio version of the same views in the Quality Report.
Strategy Breakdown
Detailed per-strategy metrics inside the portfolio context: who's contributing profit, who's contributing risk, and who's dead weight.
Risk Decomposition
Splits portfolio risk by source. A portfolio where one strategy contributes 70% of the risk isn't really diversified, no matter how many names are in it.
An insights footer links you to the logical next steps in Allocate and Robustness.
Allocate Tab
Compares capital-split methods and sizes your portfolio in whole contracts. It's a big enough topic to have its own page — see Allocation Methods for every method and setting explained.
In short: you set your capital, pick methods from three tiers (Foundation, Professional, Institutional), click Run Comparison, and evaluate the results on a Risk / Return Map, an Equity & Drawdown overlay, and a Comparison Table. Save the winner as your portfolio's allocation.
Robustness Tab
One configuration panel, one Run Robustness Check button, one integrated answer. This replaced the older separate backtest tools (walk-forward, Monte Carlo, and stress testing now run together as a single check).
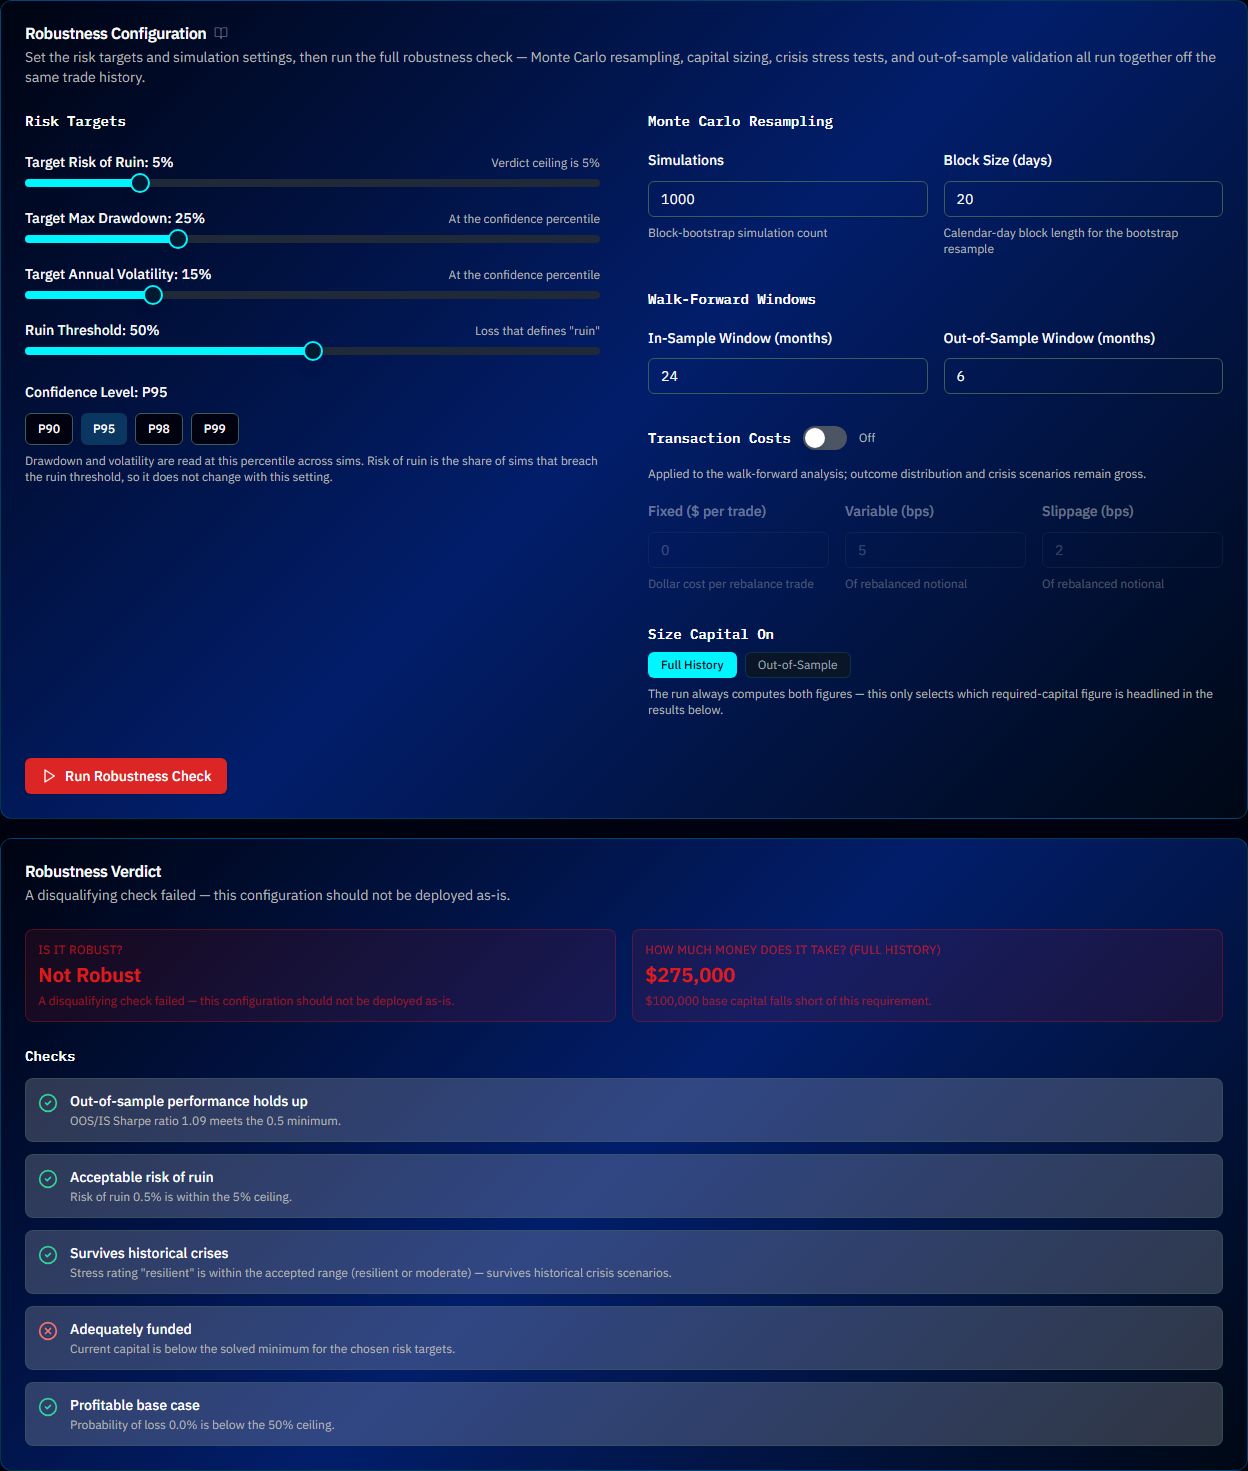
Configuration
| Group | Settings |
|---|---|
| Risk Targets | Target Risk of Ruin, Target Max Drawdown, Target Annual Volatility, Ruin Threshold, and Confidence Level (P90 / P95 / P98 / P99) |
| Monte Carlo Resampling | Simulations count and Block Size in days (blocks preserve streaks — see Block Bootstrap) |
| Test Multiple Block Lengths | Off by default. Switch it on to run the resample across several block lengths instead of one, and a Block Sweep panel appears in the results between Outcome Distribution and Crisis Scenarios. Use it when you want to know whether a result depends on the block length you happened to pick |
| Walk-Forward | IS Window and OOS Window in months — how history is split into "training" and "verification" segments |
| Transaction Costs | Toggle on to model Fixed ($ per trade), Variable (bps), and Slippage (bps) |
| Size Capital On | Full History or Out-of-Sample — whether capital requirements are computed from everything or only the verification window (OOS is the conservative choice) |
Results — the five pillars
- Robustness Verdict — the headline: does this portfolio hold up? Includes "How Much Money Does It Take?" at a glance.
- Capital Sizing — required capital to meet your risk targets, the binding constraint (which target is the limiting factor), and the Out-of-Sample Haircut — how much more capital the conservative OOS view demands. A goal-seek panel lets you adjust targets and re-solve.
- Outcome Distribution — the spread of simulated outcomes: percentile bands for profit and drawdown across all Monte Carlo runs.
- Crisis Scenarios — how the portfolio would have navigated historical crisis windows.
- Out-of-Sample Validation — walk-forward results including the out-of-sample equity curve. If the portfolio only performs in-sample, it's curve-fit — see Why Strategies Fail.
Saved Robustness Runs keeps prior runs so you can reload and compare configurations without re-simulating.
Tip
Run Robustness with Size Capital On: Out-of-Sample before trading a portfolio live. The OOS haircut is the single most honest number in the app — it tells you what the portfolio needs when history doesn't repeat politely.
Rotation
Info
Rotation is a new feature and is not released yet. It is being finished ahead of a wider rollout, so the Rotation and Rotation History tabs do not appear for accounts yet. This section describes what it does so you know what is coming.
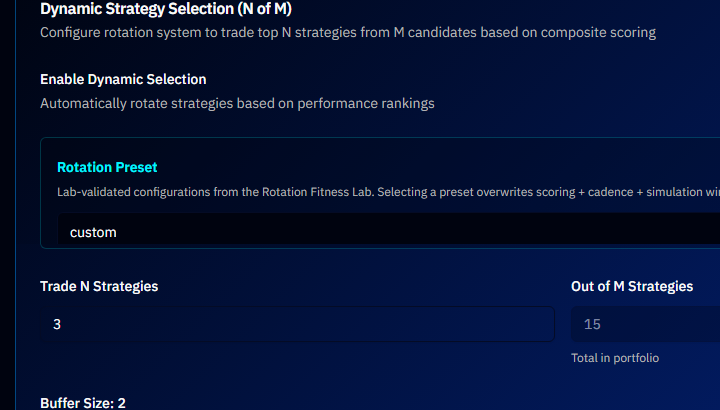
Instead of trading every member strategy at once, Rotation keeps a bench of validated strategies and actively trades only the top slice of them, re-ranked on a schedule.
Rankings are point-in-time. At each re-pick, the ranking sees only trades that had already closed by that date. This is the heart of the rebuilt engine: an earlier version ranked on all-time scores, which included trades that had not happened yet at the simulated decision point and quietly flattered every backtest it produced. A rotation result is only worth anything if the simulated decision could actually have been made with the information available at the time.
Configuration. Six ranking methods: Quality, Quality (gated), Momentum, Risk-adjusted, Drawdown-conscious, and Custom blend. Health acts as an eligibility filter and as one input to the custom blend, rather than as a method of its own. You set the re-ranking cadence and the ranking look-back independently — they are two separate dials — and each rotation window is then sized by any method from the Allocate library.
Churn control. Four independent rules can block a swap that the raw ranking would otherwise make: a buffer on ranks, a minimum holding period, a cap on turnover, and a minimum score gap before a replacement is allowed. Each window records how many swaps each rule blocked, so you can see whether the brakes are doing useful work or just getting in the way.
Transaction costs are modelled per rebalance event, so a re-pick that changes nothing costs nothing. Costs are off by default; switch them on to see the fee drag alongside the headline result.
Results are always a three-way comparison, never a single number. Every run replays the same trades three ways through identical maths — rotating, holding everything with the same capital, and picking once and never rotating — and reports nine metrics across all three. That is deliberate: rotation is only worth doing if it beats simply holding the lot, and the comparison makes a negative answer as visible as a positive one.
Rotation ships with named presets so you don't have to tune every dial yourself. The recommended default is AlgoChef Standard — tier-gated quality selection, quarterly rotation, and a five-year ranking history — the configuration that held up best across the rotation lab's cadence tests. Pick a preset to populate the whole configuration, then adjust from there.
Rotation History shows the windows of your most recently saved rotation run — what was held when, and what changed at each re-pick. It is a record of a saved simulation, not a live log of trades you placed.
Common Questions
Analyze, Allocate, Robustness — in what order? That order. Understand what you own (Analyze), decide how to size it (Allocate), then verify it survives (Robustness).
Do the tabs affect my saved portfolio? Analyze is read-only. Allocate changes your portfolio in two places: when you save a candidate, and when you click Apply Rebalance on the drift strip, which rewrites this portfolio's contract counts in place after a confirmation. Robustness never modifies the portfolio — it saves separate run results.
Why does my portfolio's CSI differ from its strategies' scores? The portfolio is scored on its combined equity curve. Diversification can lift the portfolio's Risk profile far above any member's — or correlation can drag it below.
Tip
Ready to see this in action? Start your 14-day free trial.