Monte Carlo Simulation
Monte Carlo simulation tests your strategy's robustness by running thousands of randomized variations. If a strategy only works with trades in the exact order they occurred, it's fragile. Monte Carlo reveals how it performs under different conditions.
This is one of the most common reasons strategies fail in live trading — see Why Strategies Fail for the full picture.
Where to find it: In the app sidebar, open Monte Carlo. It has four tools, each covered below:
| Sidebar entry | What it answers |
|---|---|
| Robustness Test | Is my edge real, or lucky trade sequencing? |
| Health Validation | Does the edge persist out-of-sample, or is it overfit? |
| Capital Sizing | How much capital do I need to trade this safely? |
| Survival Test | Will the strategy survive degraded conditions? |
A fifth tool, Crisis Dependency, also lives under the Benchmark section and is covered on its own page.
On the Robustness Test and Health Validation pages you pick a strategy, set Starting Capital and Number of Simulations/Method in the Simulation Settings card, and click Run Simulation (or Run Validation). Progress is shown per method as the engine works through Shuffle, Bootstrap, Block Bootstrap, Parametric, and Stress+.
What Makes AlgoChef's Monte Carlo Different
Most Monte Carlo tools ask one question: "What is my net profit at the 95th percentile?"
AlgoChef asks a fundamentally different question: "Does my strategy's composite quality score stay stable across thousands of randomized scenarios?"
Here's why that distinction matters. Net profit at a single confidence level tells you one number about one outcome. It says nothing about whether your strategy's risk profile, statistical reliability, or overall quality holds up under randomization — or collapses.
AlgoChef's Monte Carlo recalculates the full CSI (Casey Strategy Index) — and all three of its components (Profitability Score, Risk Score, and Confidence Score) — for every single simulation run, across all five methods. Each run produces a complete multi-dimensional quality assessment, not just a P&L figure.
The result: AlgoChef measures the variability and stability of your strategy's composite score across thousands of scenarios. If the CSI and its components remain stable across simulations, the strategy is marked as robust. If they collapse or vary wildly, the strategy is fragile — regardless of what the net profit line shows.
This gives you confidence intervals across 20+ metrics spanning all three scoring dimensions, displayed as gauges — the same visual system as the Strategy Analyzer — so you can immediately see where your strategy holds up and where it doesn't.
Info
The difference in plain English: Other tools tell you "your worst-case net profit is X." AlgoChef tells you "your strategy's overall quality — across profitability, risk, and statistical reliability — stays strong even under randomization." That's a much more meaningful test of robustness.
Simulation Methods
AlgoChef offers five simulation methods, each testing a different aspect of robustness:
1. Shuffle (Fisher-Yates)
Randomly reorders your trades. Tests whether the strategy's profitability depends on the specific sequence of wins and losses.
Best for: Checking if results are order-dependent.
2. Bootstrap (With Replacement)
Randomly samples trades from your history, allowing the same trade to appear multiple times. Simulates "what if I had more/fewer of certain types of trades."
Best for: Estimating the range of possible outcomes with your trade distribution.
3. Block Bootstrap
Preserves consecutive trade sequences (streaks) while shuffling blocks. Maintains the temporal structure of winning and losing streaks.
Best for: Strategies where streaks matter (mean-reversion or momentum systems).
4. Parametric
Generates synthetic trades based on your strategy's statistical profile (mean, standard deviation, skewness). Creates entirely new trade sequences.
Best for: Testing if the statistical edge holds in synthetic scenarios.
5. Stress+ (Shuffle + Noise)
Shuffles trades AND adds random noise to each trade's P&L. The most aggressive test.
Best for: Worst-case scenario analysis with degraded trade quality.
Robustness Test (Full History)
What It Tests
The Robustness Test answers: "Is my strategy's edge real, or just a product of lucky trade sequencing?"
It runs thousands of simulations across your entire trade history, reshuffling and resampling trades to see if your strategy's quality scores hold up — or collapse.
How to Read Results
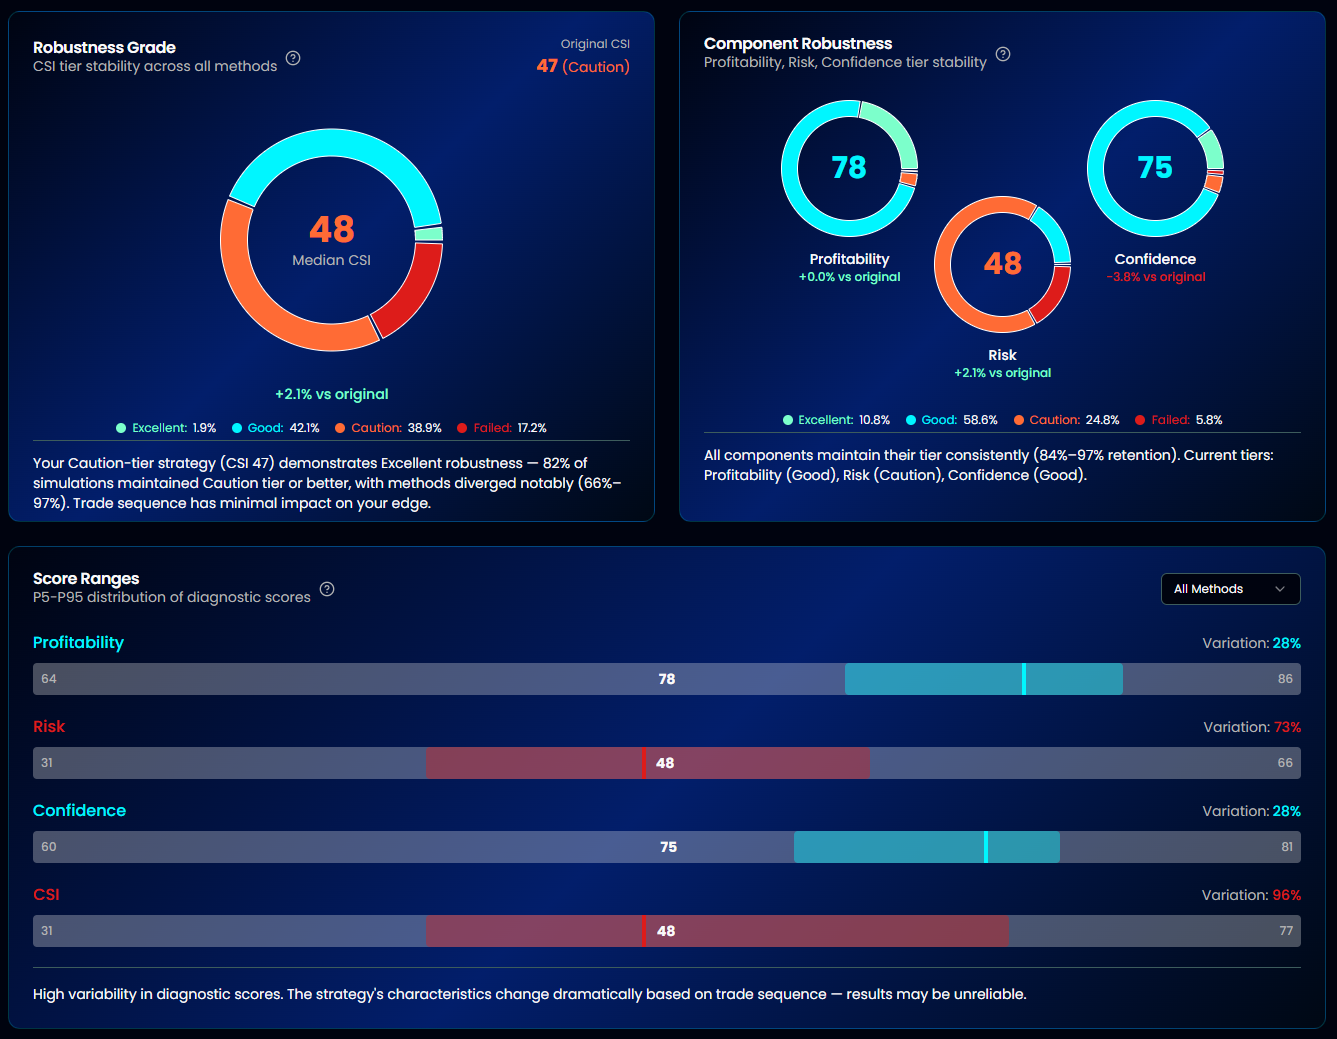
Robustness Grade
The headline metric. It measures tier stability — the percentage of simulations where your strategy's CSI stays in the same tier as the median result.
| Grade | Tier Stability | Meaning |
|---|---|---|
| Excellent | ≥90% | Edge is highly robust across randomization |
| Good | 75–89% | Edge is solid with minor variability |
| Caution | 50–74% | Significant quality variation — investigate |
| Failed | Below 50% | Strategy is fragile — results are order-dependent |
Tier Stability %
The exact percentage of simulations that stayed in the same CSI tier. A strategy with 94% tier stability means only 6% of simulations dropped (or rose) to a different tier.
Component Robustness
Breaks down stability across the three CSI components:
- Profitability Score — Does return quality hold up under randomization?
- Risk Score — Do drawdowns and volatility stay controlled?
- Confidence Score — Does statistical reliability remain stable?
If one component is significantly less stable than others, it pinpoints exactly where the strategy is fragile.
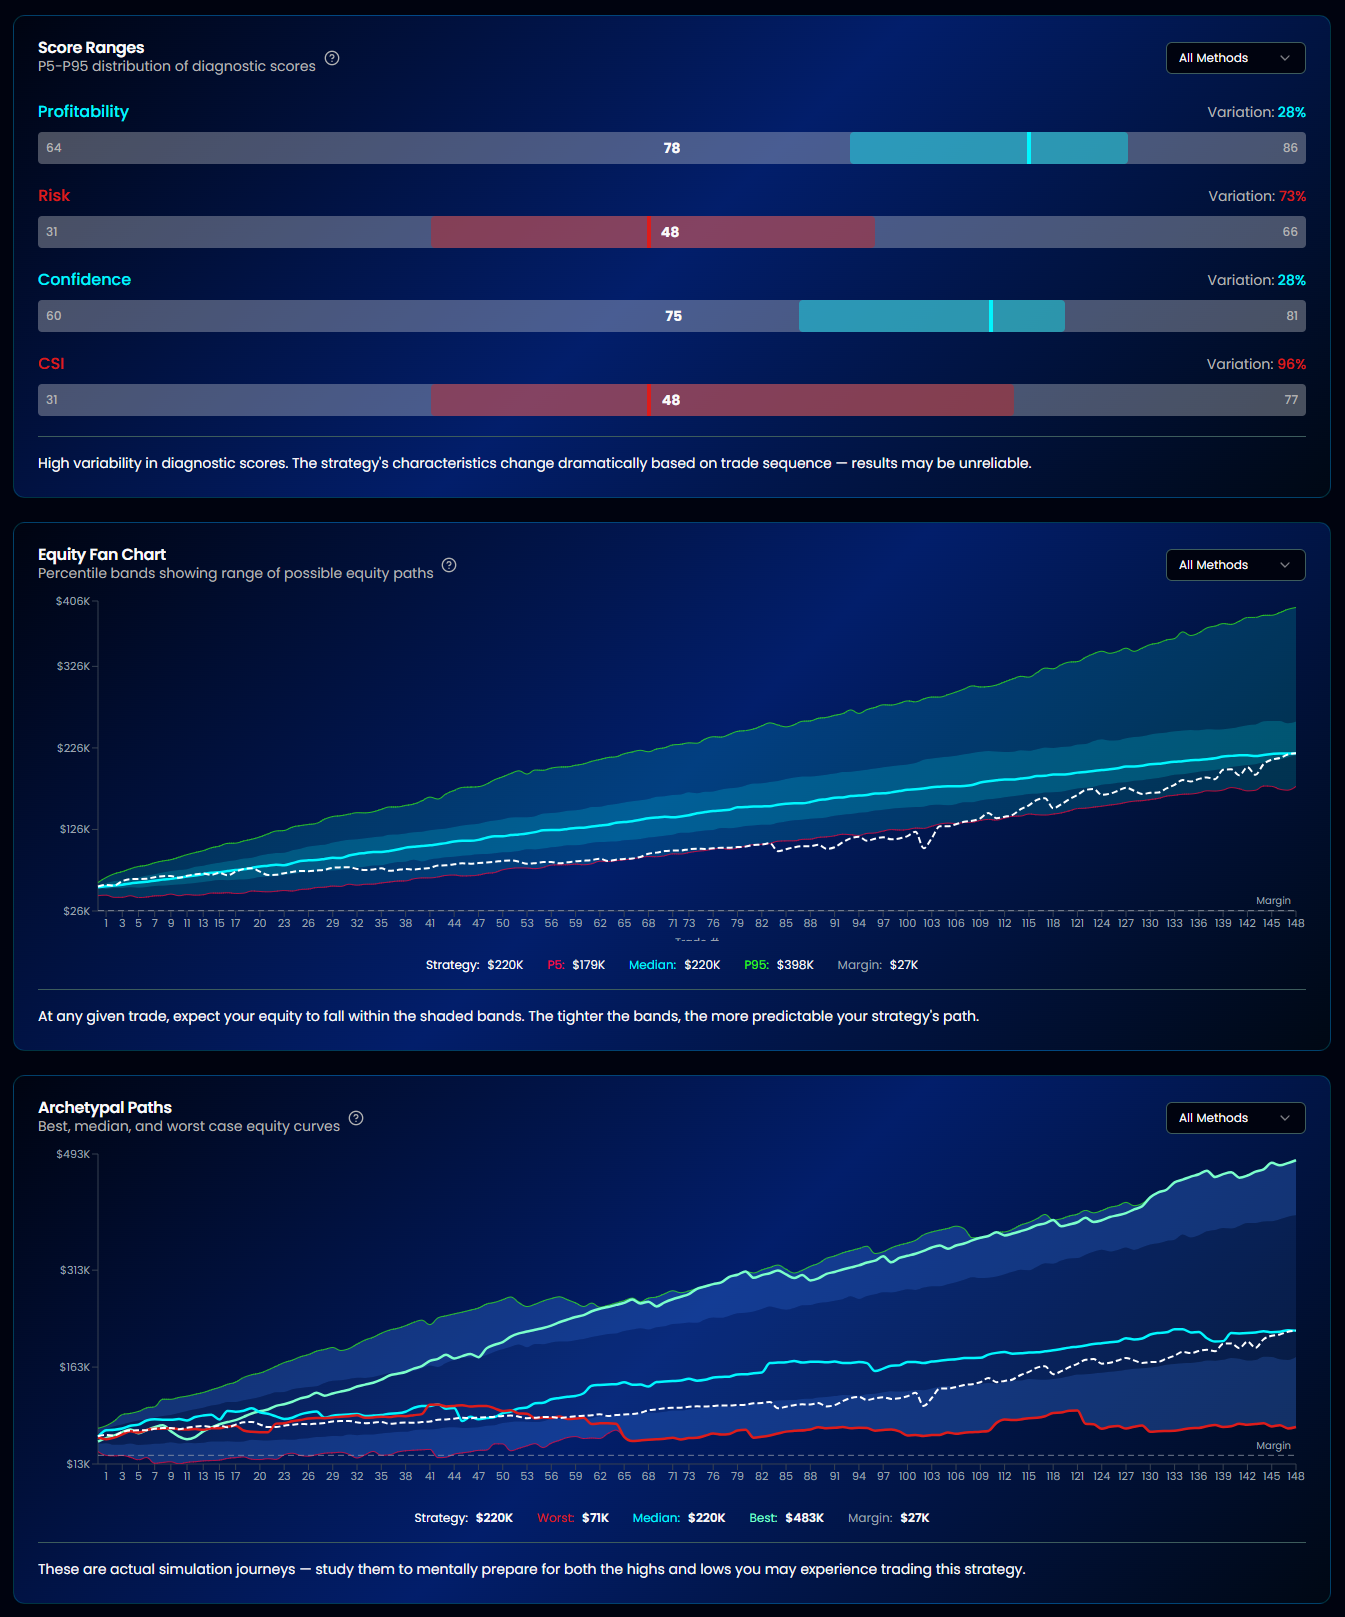
Equity Fan Chart
A visual showing all simulation equity curves overlaid. The spread of the "fan" tells you how much path dependency affects outcomes. A tight fan = robust; a wide fan = order-dependent.
Confidence Intervals
| Percentile | Meaning |
|---|---|
| 50% | Median outcome — what's most likely |
| 75% | 3 out of 4 simulations were better than this |
| 90% | Only 10% of simulations were worse |
| 95% | Near worst-case |
| 99% | Extreme worst-case |
These intervals are calculated across 20+ metrics, not just net profit.
Health Validation (IS/OOS)
What It Tests
Health Validation answers: "Does my strategy's edge persist out-of-sample?"
It splits your trade history into In-Sample (75%) and Out-of-Sample (25%) periods, then runs Monte Carlo simulations on each. If the IS and OOS distributions diverge significantly, your strategy may be overfit to historical data.
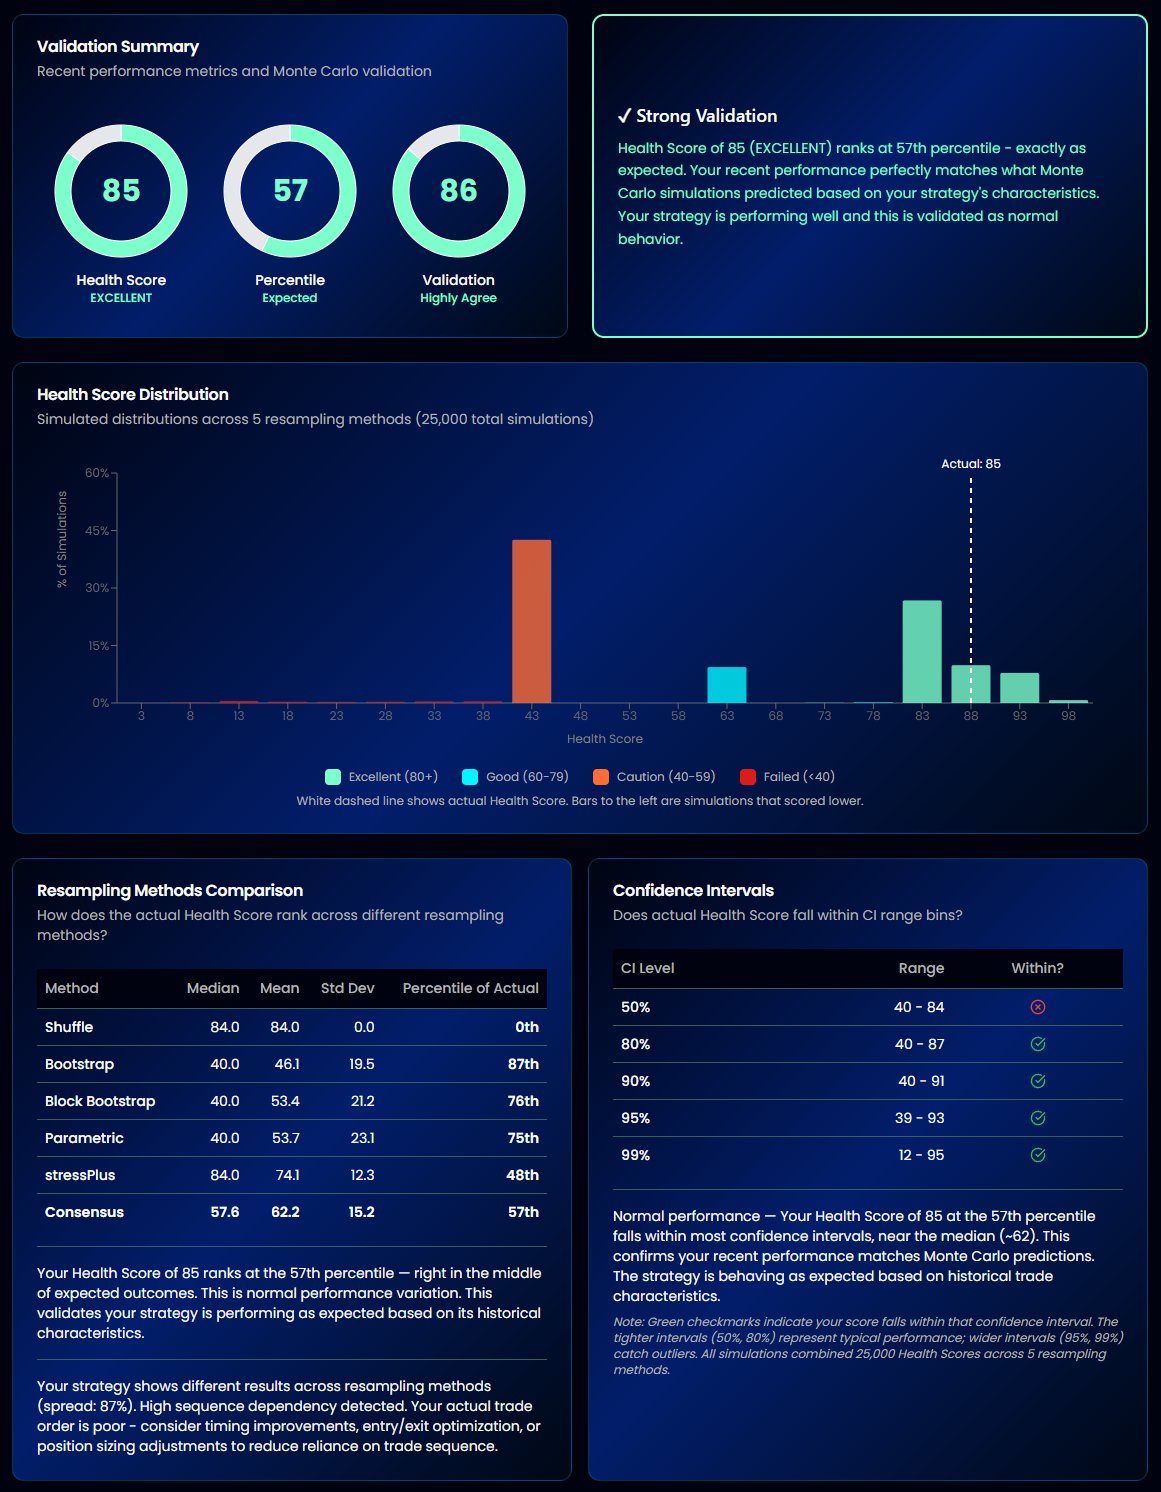
How to Read Results
- Health Score Comparison — Compares the database health score with the Monte Carlo-calculated health score to validate consistency
- Method Histograms — Distribution of scores across simulation methods, showing overlap (or divergence) between IS and OOS
- IS vs OOS Divergence — Quantifies how much the out-of-sample results deviate from in-sample expectations
Info
A strategy that scores Excellent in-sample but Caution out-of-sample is likely overfit. Look for strategies where IS and OOS distributions overlap significantly.
Capital Sizing
What It Tests
Capital Sizing answers: "How much capital do I actually need to trade this strategy safely?"
It uses Monte Carlo simulations to model Risk of Ruin (RoR) and maximum drawdown probabilities at different capital levels, giving you data-driven capital recommendations.
Configuration Options
| Parameter | Default | Description |
|---|---|---|
| Starting Capital ($) | Auto (2× margin) | Your account size — auto-calculated from margin requirements |
| Number of Simulations/Method | Auto | Number of Monte Carlo runs |
| Resampling Method | Bootstrap | Simulation method to use |
| Risk of Ruin Threshold | 50% | Capital level that constitutes "ruin" |
| Max DD Threshold | 25% | Maximum drawdown you're willing to tolerate |
| Confidence Level | 98% | Statistical confidence for recommendations |
Click Run Capital Analysis to start.
How to Read Results
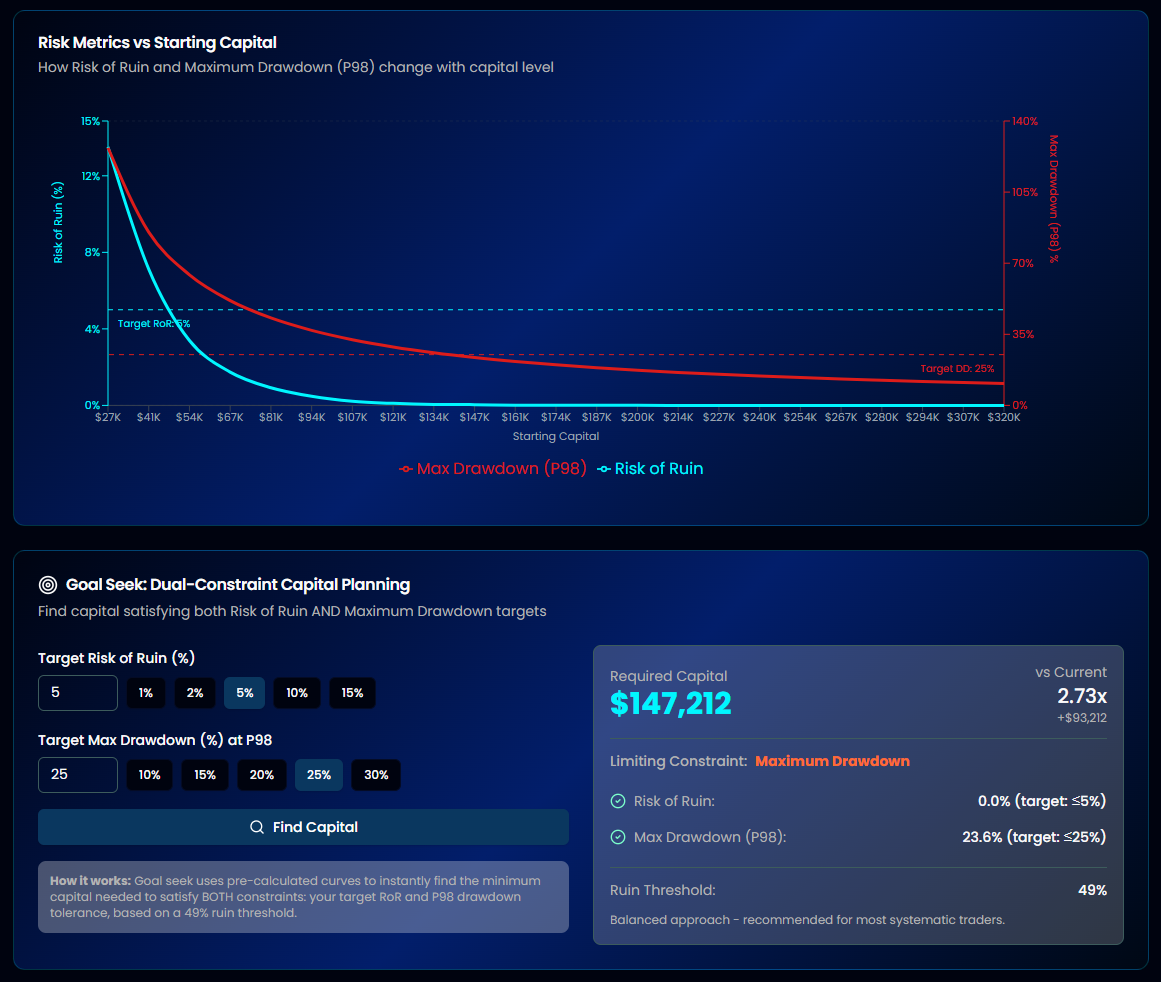
Dual Curve Chart
Shows two curves plotted against starting capital:
- Risk of Ruin curve — Probability of hitting your ruin threshold at each capital level
- Max Drawdown curve — Probability of exceeding your drawdown threshold
The intersection of these curves with your risk tolerance gives your minimum capital requirement.
Goal Seek: Dual-Constraint Capital Planning
Automatically finds the optimal starting capital for your risk parameters. It searches for the minimum capital where:
- Risk of Ruin stays below your confidence level
- Maximum drawdown stays within your threshold
Tip
If your strategy requires margin, the calculator accounts for this automatically. The minimum capital recommendation will always be at least 110% of your margin requirement.
Survival Test (Stress Testing)
What It Tests
The Survival Test answers: "Will my strategy survive degraded market conditions?"
It systematically degrades your strategy's performance metrics — reducing win rate, shrinking profits, and increasing losses — then runs Monte Carlo simulations under each scenario to see if the strategy remains viable.
Predefined Scenarios
Seven scenarios with progressively worse conditions:
| Scenario | Win Rate ↓ | Profit ↓ | Loss ↑ | Consecutive Losses |
|---|---|---|---|---|
| Baseline | 0% | 0% | 0% | — |
| Mild Stress | 5% | 10% | 10% | — |
| Moderate Stress | 10% | 20% | 15% | — |
| Severe Stress | 15% | 30% | 25% | — |
| Extreme Stress | 20% | 40% | 35% | — |
| 5 Consecutive Losses | — | — | — | 5 in a row |
| 10 Consecutive Losses | — | — | — | 10 in a row |
The degradation scenarios progressively stress the three core performance levers. The consecutive loss scenarios test streak resilience independently.
How to Read Results
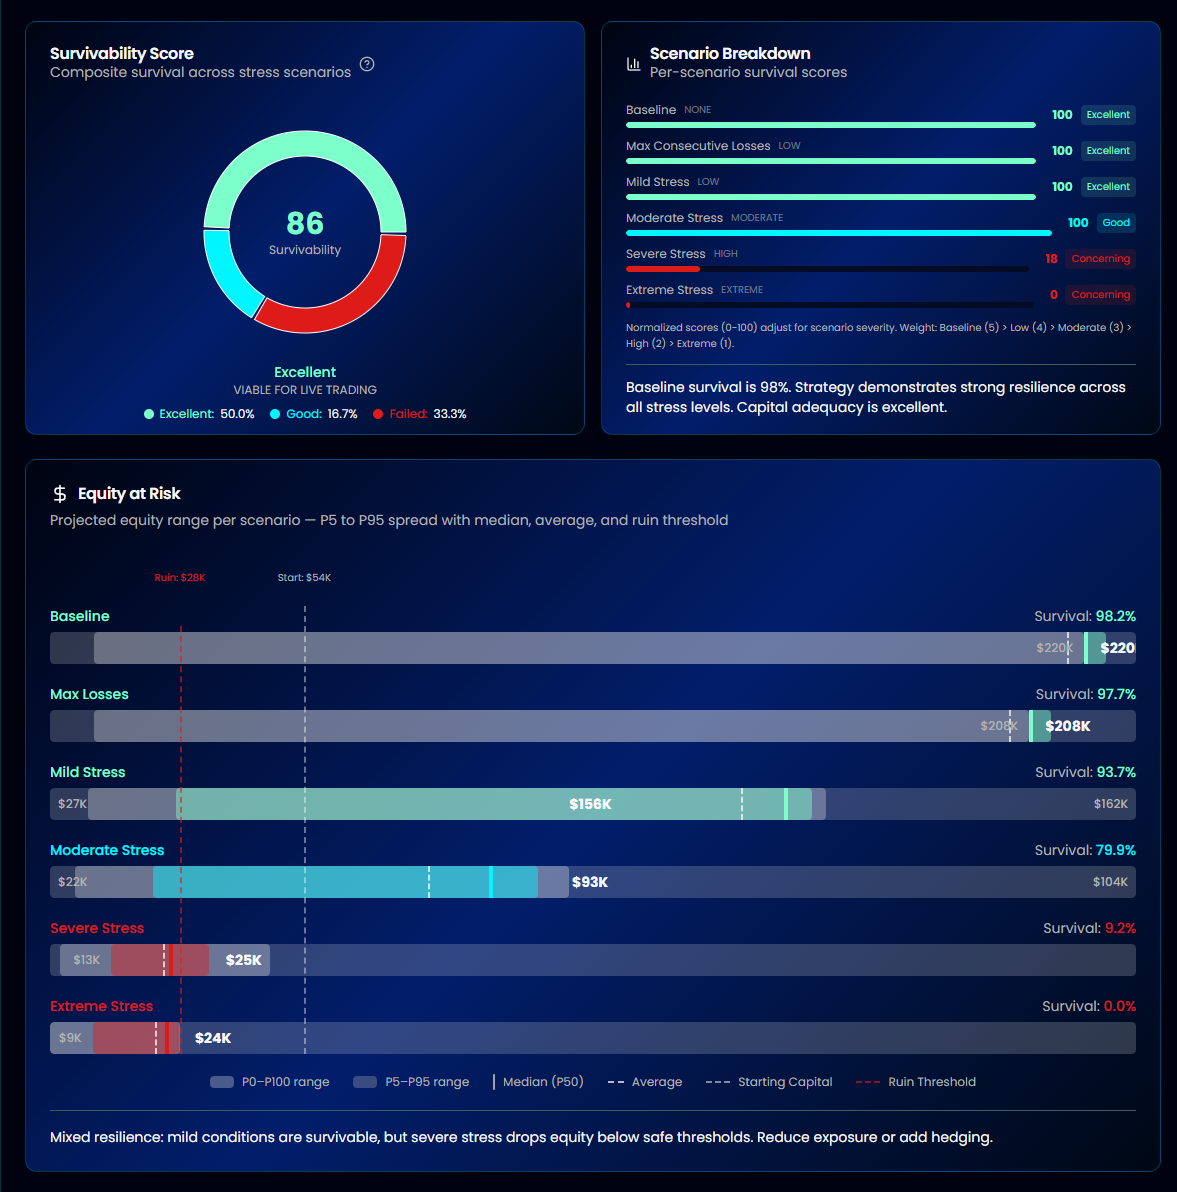
Survivability Score (0–100)
The headline metric. A weighted average of normalized survival rates across all scenarios, where more severe scenarios carry less weight (since they represent increasingly unlikely conditions).
| Score | Grade | Status |
|---|---|---|
| ≥80 | Excellent | Viable for live trading |
| 60–79 | Good | Tradable with awareness |
| 40–59 | Caution | Increase capital before trading |
| Below 40 | Concerning | Not viable at this capital level |
Survival Rate per Scenario
Each scenario shows what percentage of simulations survived (didn't hit ruin). The thresholds for "good" survival vary by severity — a 50% survival rate under Extreme Stress is actually rated Excellent, while the same rate under Baseline would be Concerning.
Severity-Aware Thresholds
| Severity | Excellent | Good | Caution |
|---|---|---|---|
| None (Baseline) | ≥95% | 85–94% | 70–84% |
| Low | ≥90% | 75–89% | 55–74% |
| Moderate | ≥80% | 60–79% | 40–59% |
| High | ≥65% | 45–64% | 25–44% |
| Extreme | ≥50% | 30–49% | 15–29% |
Set Starting Capital ($) and Number of Simulations, then click Run Stress Tests. The education tabs above the results (Overview, Baseline, Max Consecutive Losses, Mild/Moderate/Severe/Extreme Stress) explain each scenario in detail.
Related: Crisis Dependency Analysis
After stress-testing with Monte Carlo, you may also want to check whether your strategy depends on market crises. Crisis Dependency Analysis removes trades from major crisis periods (2008 GFC, COVID, etc.) and recalculates your scores to reveal if your edge disappears without market panics.
Robustness vs Survivability: Quick Reference
These two tests answer different but complementary questions:
| Robustness Test | Survival Test | |
|---|---|---|
| Question | Is the edge real? | Can it survive bad conditions? |
| What changes | Trade order/selection | Win rate, profit size, loss size |
| Measures | CSI tier stability | Survival rate under stress |
| Tells you | If results depend on lucky sequencing | If the strategy has enough margin of safety |
| Use when | Validating backtest quality | Sizing capital for live trading |
Tip
A strategy can be robust (edge is real) but not survivable (not enough capital buffer), or survivable but not robust (lucky sequencing masks a weak edge). You want both.
Tips for Getting the Most from Monte Carlo
- Run all five methods — Each reveals different fragilities. A strategy that passes Shuffle but fails Parametric may have distributional assumptions baked in.
- Check component robustness — If Profitability is stable but Risk is not, your drawdown management needs work.
- Use Capital Sizing before going live — The goal seek function gives you a data-driven minimum, not a guess.
- Don't ignore consecutive loss scenarios — Even strategies with high win rates can be devastated by unexpected streaks.
- Run Health Validation before trusting robustness — A strategy that's robust in-sample but diverges out-of-sample is likely overfit.
- Check crisis dependency — A strategy that only works during market panics will underperform in calm markets. Use Crisis Dependency Analysis to find out.
Tip
Ready to stress-test your strategy? Start your free trial — no credit card required.