Your First Monte Carlo Run
Your backtest shows one version of history — the exact sequence of trades that happened to occur. Monte Carlo asks: what if history had shuffled the deck? If a strategy only works with its trades in one lucky order, it's fragile. This lesson runs your first test and teaches you to read the result.
Info
No imported strategy yet? Use a sample — Sample_Gold_Standard_ES_Daily_Long and Sample_Paper_Tiger_VX_Daily_Long make an instructive pair for exactly this lesson.
Step 1: Open the Robustness Test
From the app sidebar, open Monte Carlo → Robustness Test. (The other three tools — Health Validation, Capital Sizing, Survival Test — build on the same engine; ignore them today.)
Step 2: Configure and run
Pick your strategy at the top, then in the Simulation Settings card:
- Starting Capital — use the same value as the strategy's import settings, so percentages stay comparable
- Number of Simulations/Method — the default is fine for a first run; more simulations = smoother statistics, longer wait
Click Run Simulation. The engine works through five randomization methods — Shuffle, Bootstrap, Block Bootstrap, Parametric, and Stress+ — each testing a different kind of fragility. Progress shows per method. (What each method does: Monte Carlo reference.)
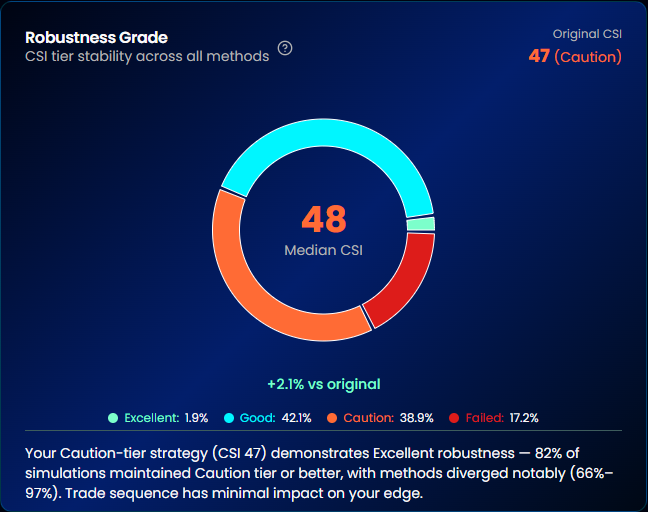
Step 3: Read the Robustness Grade first
The first thing in the results is the Robustness Grade — the headline verdict. Next to it, Score Robustness shows how the Profitability, Risk and Confidence scores held up.
Here's the key idea, because it's what makes AlgoChef's Monte Carlo different: the engine doesn't just check whether net profit survives randomization. It recalculates the strategy's quality scores (CSI and the other scores) for every single simulated run, then measures how stable those scores are across thousands of scenarios.
- Scores stay tight across simulations → the edge is a property of the strategy, not of one lucky sequence
- Scores scatter or collapse → the backtest's quality depends on circumstances that randomization destroys — fragile
Step 4: Scan the supporting evidence
Below the grade:
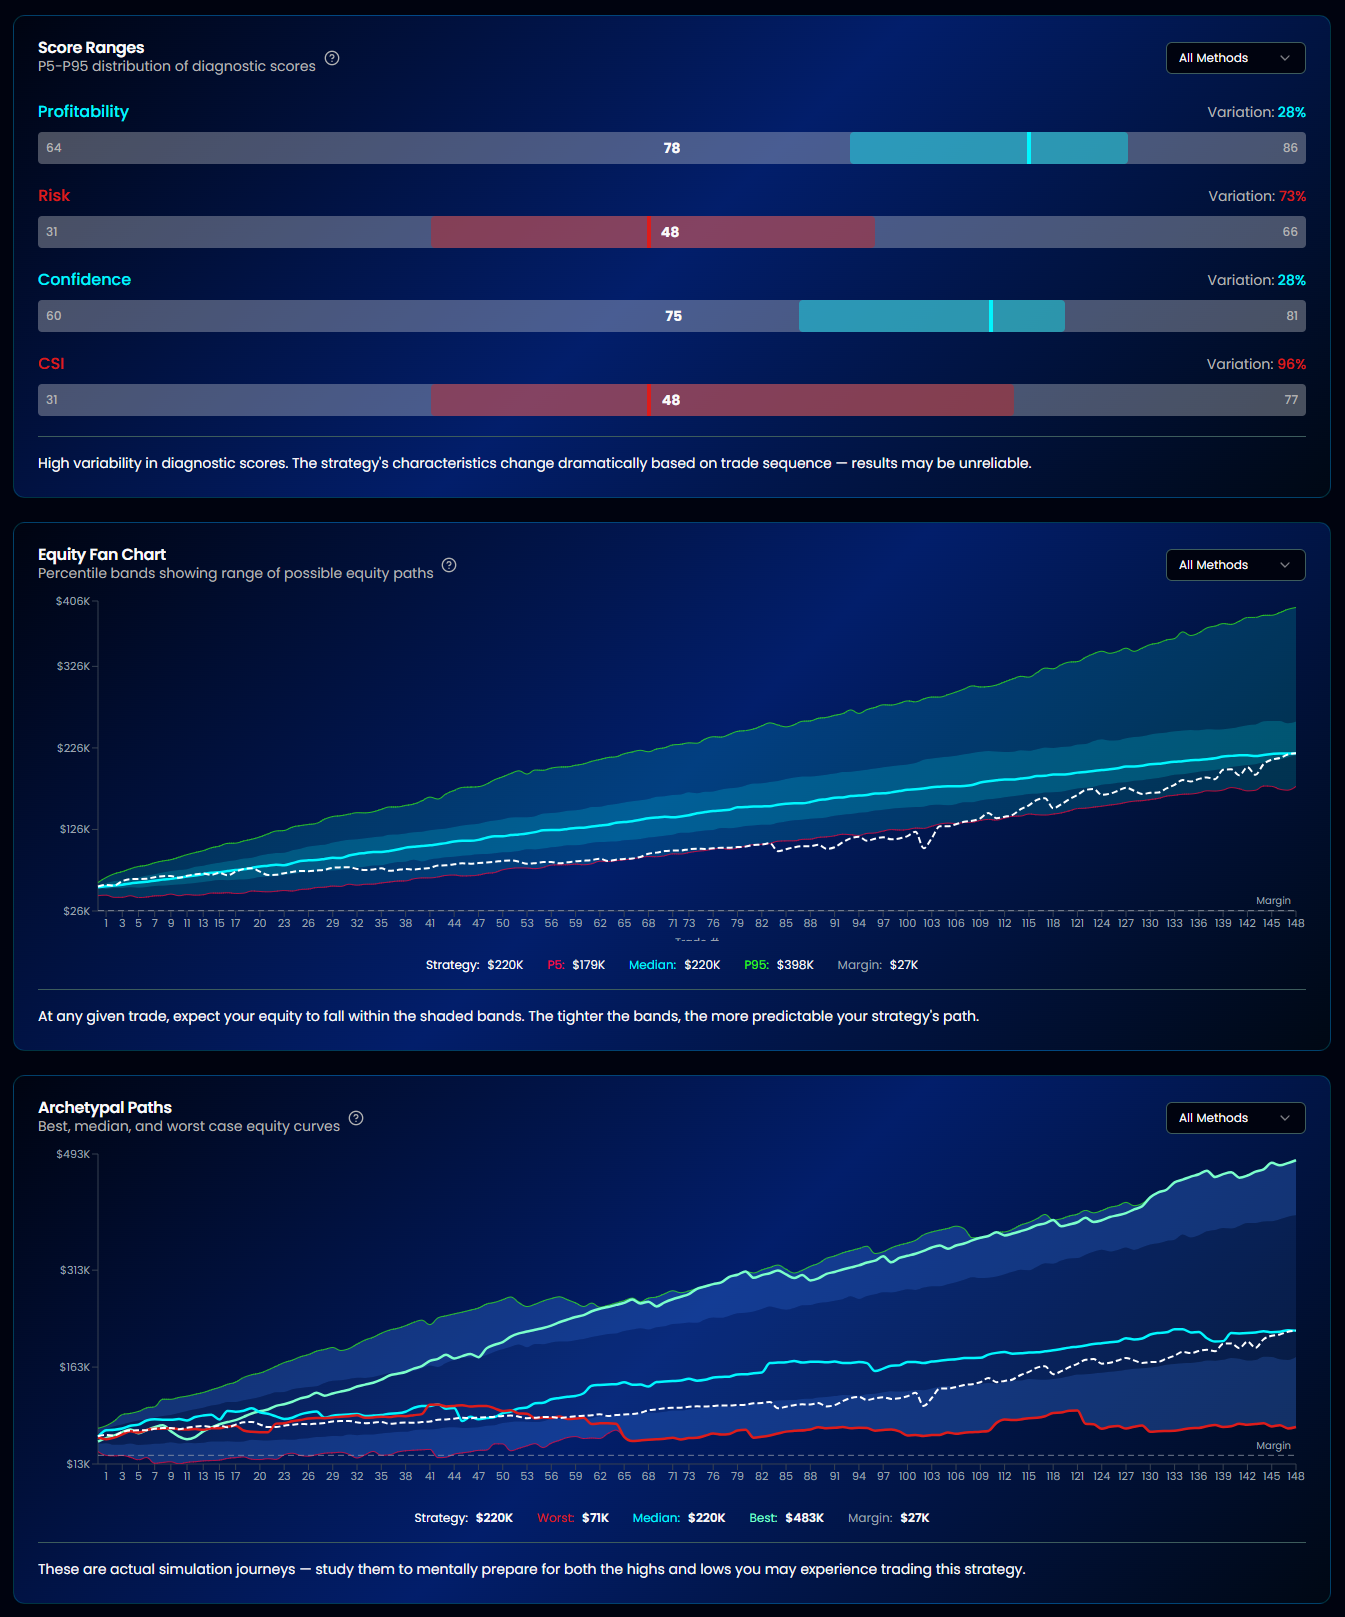
- Score Ranges — gauges showing the spread of each score across runs. Wide range = instability.
- Equity Fan Chart — every simulated equity path overlaid. A tight upward fan is what you want; a fan where many paths dip deep or end negative shows realistic bad-luck outcomes your single backtest never revealed.
Step 5: The comparison that builds intuition
Run the same test on a second, weaker strategy (this is why the samples exist). Watch how the fan widens and the grade drops even when the backtest equity curves look similarly attractive. That difference — invisible in a normal backtest report — is the whole reason Monte Carlo exists.
Warning
A good Robustness Grade doesn't promise future profits — it rules out one specific failure mode (sequence luck). Degradation, regime change, and overfitting are tested by other tools: that's the Health Monitor and Health Validation.
What you learned
- Robustness Test = "does the edge survive shuffled history?"
- Read the Robustness Grade first, then Score Ranges and the fan chart
- AlgoChef stress-tests the quality scores, not just the profit line
Next lesson
Sequence luck is ruled out. Next threat: a strategy that's quietly dying. Your First Health Check →