Head-to-Head Strategy Comparison
Compare up to 8 strategies head-to-head with institutional-grade analysis. Head-to-Head creates frozen-in-time comparison snapshots with rebased equity curves, rolling statistics, calendar-return heatmaps, correlation matrices, tail metrics, and statistical significance — shareable via public link or exportable as CSV / PNG.
Where to find it: In the app sidebar, open Benchmark → Head-to-Head. The page shows your library of saved comparisons plus a strategy picker for creating new ones.
How to Compare
- On the Head-to-Head page, select 2–8 strategies with the strategy picker
- Click Create Head-to-Head (N) →
- Name your comparison, assign strategies to slots, and pin the slots that should anchor the chart visuals (slot 1 is the base for statistical-significance comparisons)
- AlgoChef generates a full institutional report
Saved comparisons are frozen snapshots. If your strategies have new trades, use Recalculate all (N) on the library page to refresh every comparison — share URLs keep working and reflect updated metrics.
What You Get
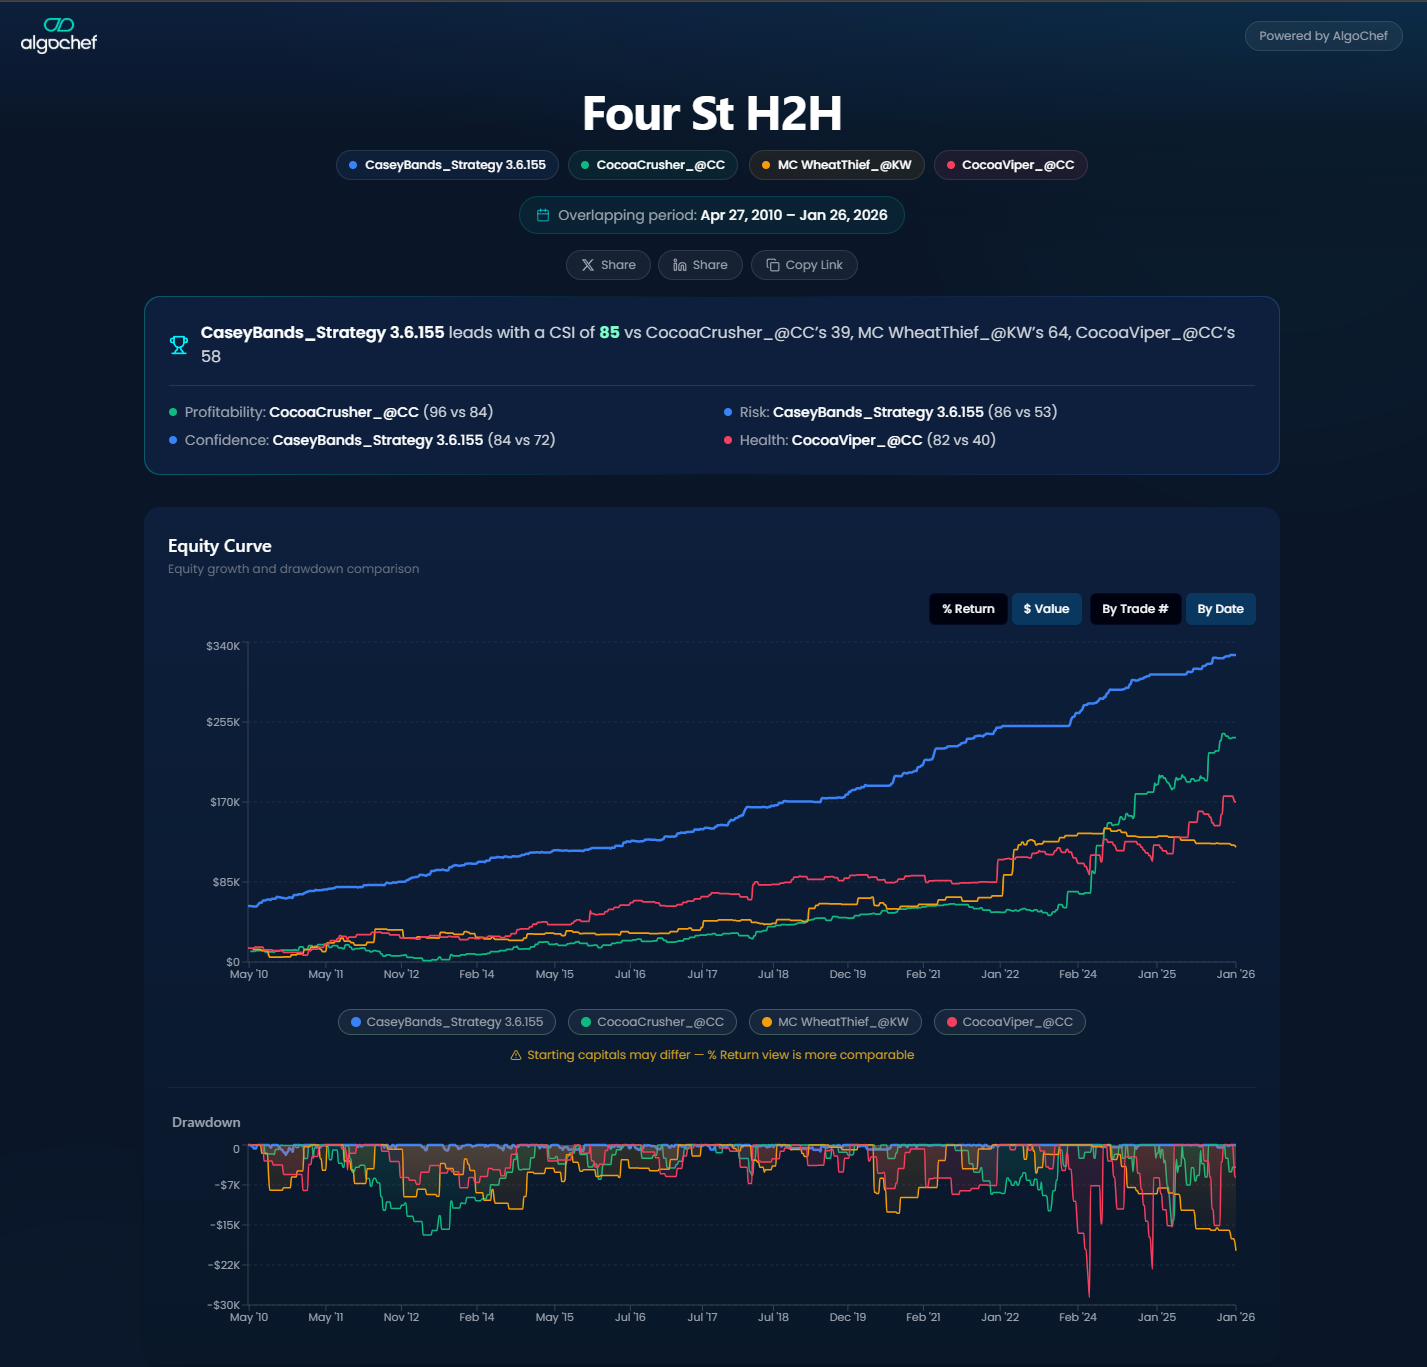
Verdict + Five-Score Grid
Highest-CSI winner across the comparison plus per-slot CSI, Profitability, Risk, Confidence, and Health scores — color-coded by tier.
Rebased Equity & Drawdown Overlays
All equity curves are rebased to a common starting point. Pinned slots also get a drawdown overlay and a time-under-water (underwater) curve so you can see how each strategy handles stress. Axis toggles let you switch between calendar dates and trade index on the x-axis, and between % and $ on the y-axis.
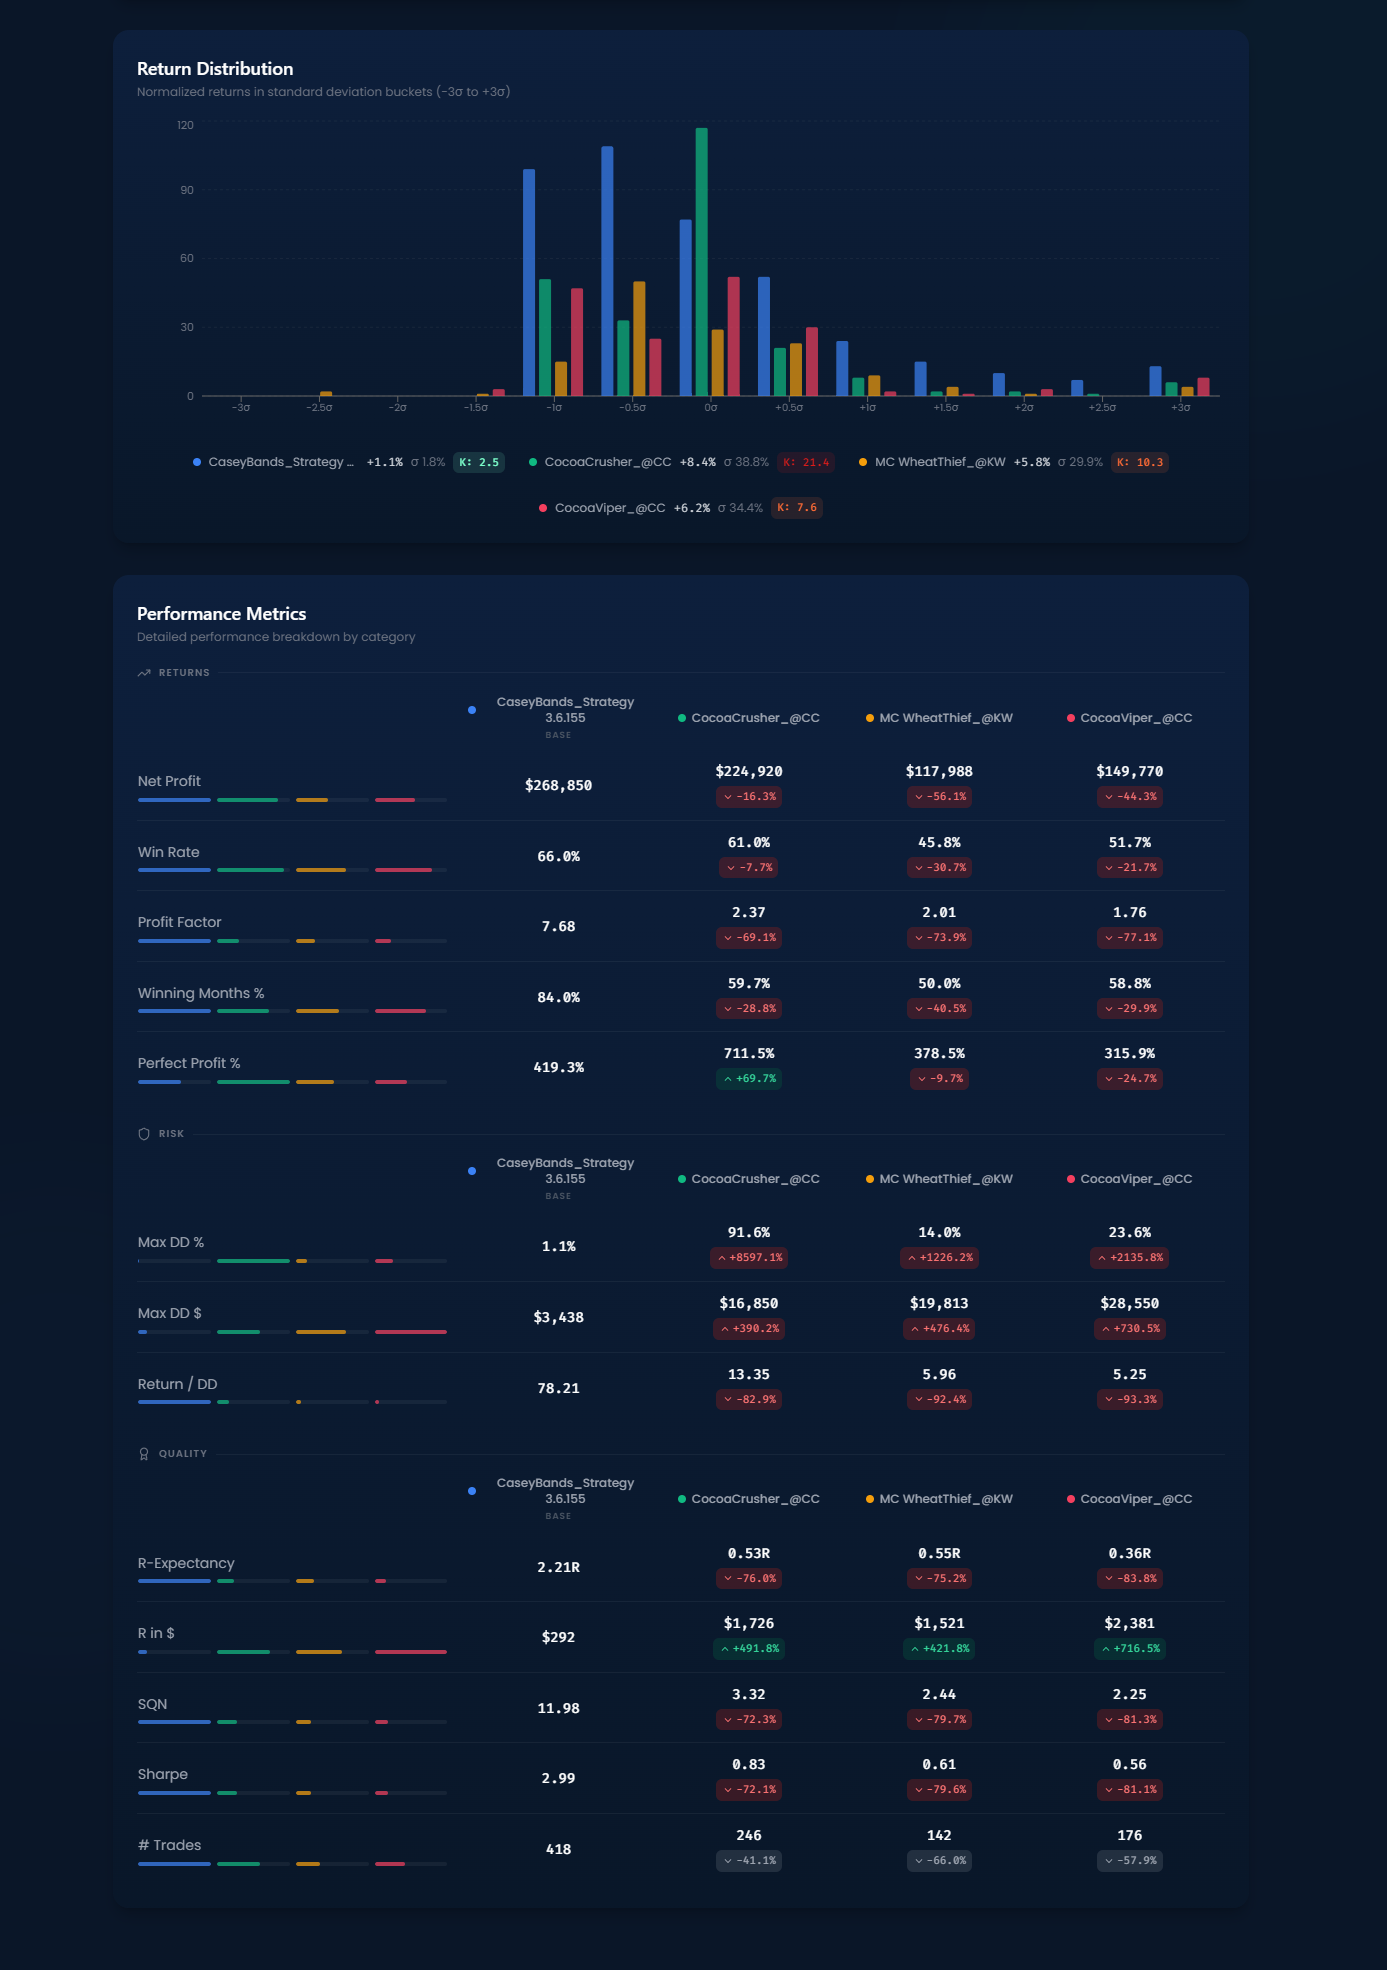
Risk-Adjusted Ranking Table
Sortable ranking across CSI, CAGR, Sortino, Max Drawdown, and CVaR — with per-slot rank badges and one-click drill-in to Strategy vs Benchmark and Crisis Dependency.
Rolling Sharpe / Sortino / Volatility
60-trade rolling windows over the per-trade return series for every pinned slot. Spot regime changes and stability shifts at a glance.
Distribution + Tail Metrics
Per-trade return histogram plus per-slot tail metrics — CVaR (5%), worst single-trade loss, and worst calendar month.
Calendar Returns Heatmap
Year × month heatmap of monthly returns per slot. Switch between slots inline.
Correlation Matrix
Pairwise correlation between every slot's return stream — useful for portfolio construction.
Capture Ratios + Capacity
Up / down capture vs SPY plus trades-per-year and average hold time so you can sanity-check liquidity and turnover.
Statistical Significance
Welch's t-test and confidence intervals for every slot vs the base slot's per-trade returns.
MAE / MFE Quadrant
Per-pinned-slot Maximum Adverse / Favorable Excursion to surface entry-quality signal.
Full Metrics Table
Every v2 metric across every slot in one scrollable table — no hidden columns.
Lite vs Institutional View
In-app default is the institutional view (all 11 sections). The Lite toggle in the sticky header collapses to the four headline sections (Verdict, Equity / Drawdown / Underwater, Risk-Adjusted Ranking, Full Metrics). The toggle persists across sessions.
Public share links default to a retail-friendly density — Verdict, Equity overlay, Drawdown overlay, and a six-row Headline Metrics table. The "Show full institutional report" button reveals every deeper section.
Sharing & Export
- Public Links — Share your comparison via a public URL. Viewers don't need an AlgoChef account.
- CSV Export — One row per slot with all institutional metrics + a correlation column. (Currently in limited rollout — if you don't see the button, it isn't enabled for your account yet.)
- PNG Export — Captures the full institutional report at 2× resolution for presentations. (Same limited rollout.)
- Cross-Links — From any slot's row in the ranking table, drill in to Strategy vs Benchmark or Crisis Dependency in one click.
Info
Comparison snapshots are immutable — once created, every metric and curve is frozen. This makes them reliable for historical reference and sharing.
Tip
The base slot (slot 1) drives statistical-significance comparisons. Put your benchmark or "incumbent" strategy in slot 1.