Stress-test with five simulation methods
Know if your edge is real before risking real money. Five simulation methods, four analysis tabs, one definitive answer.
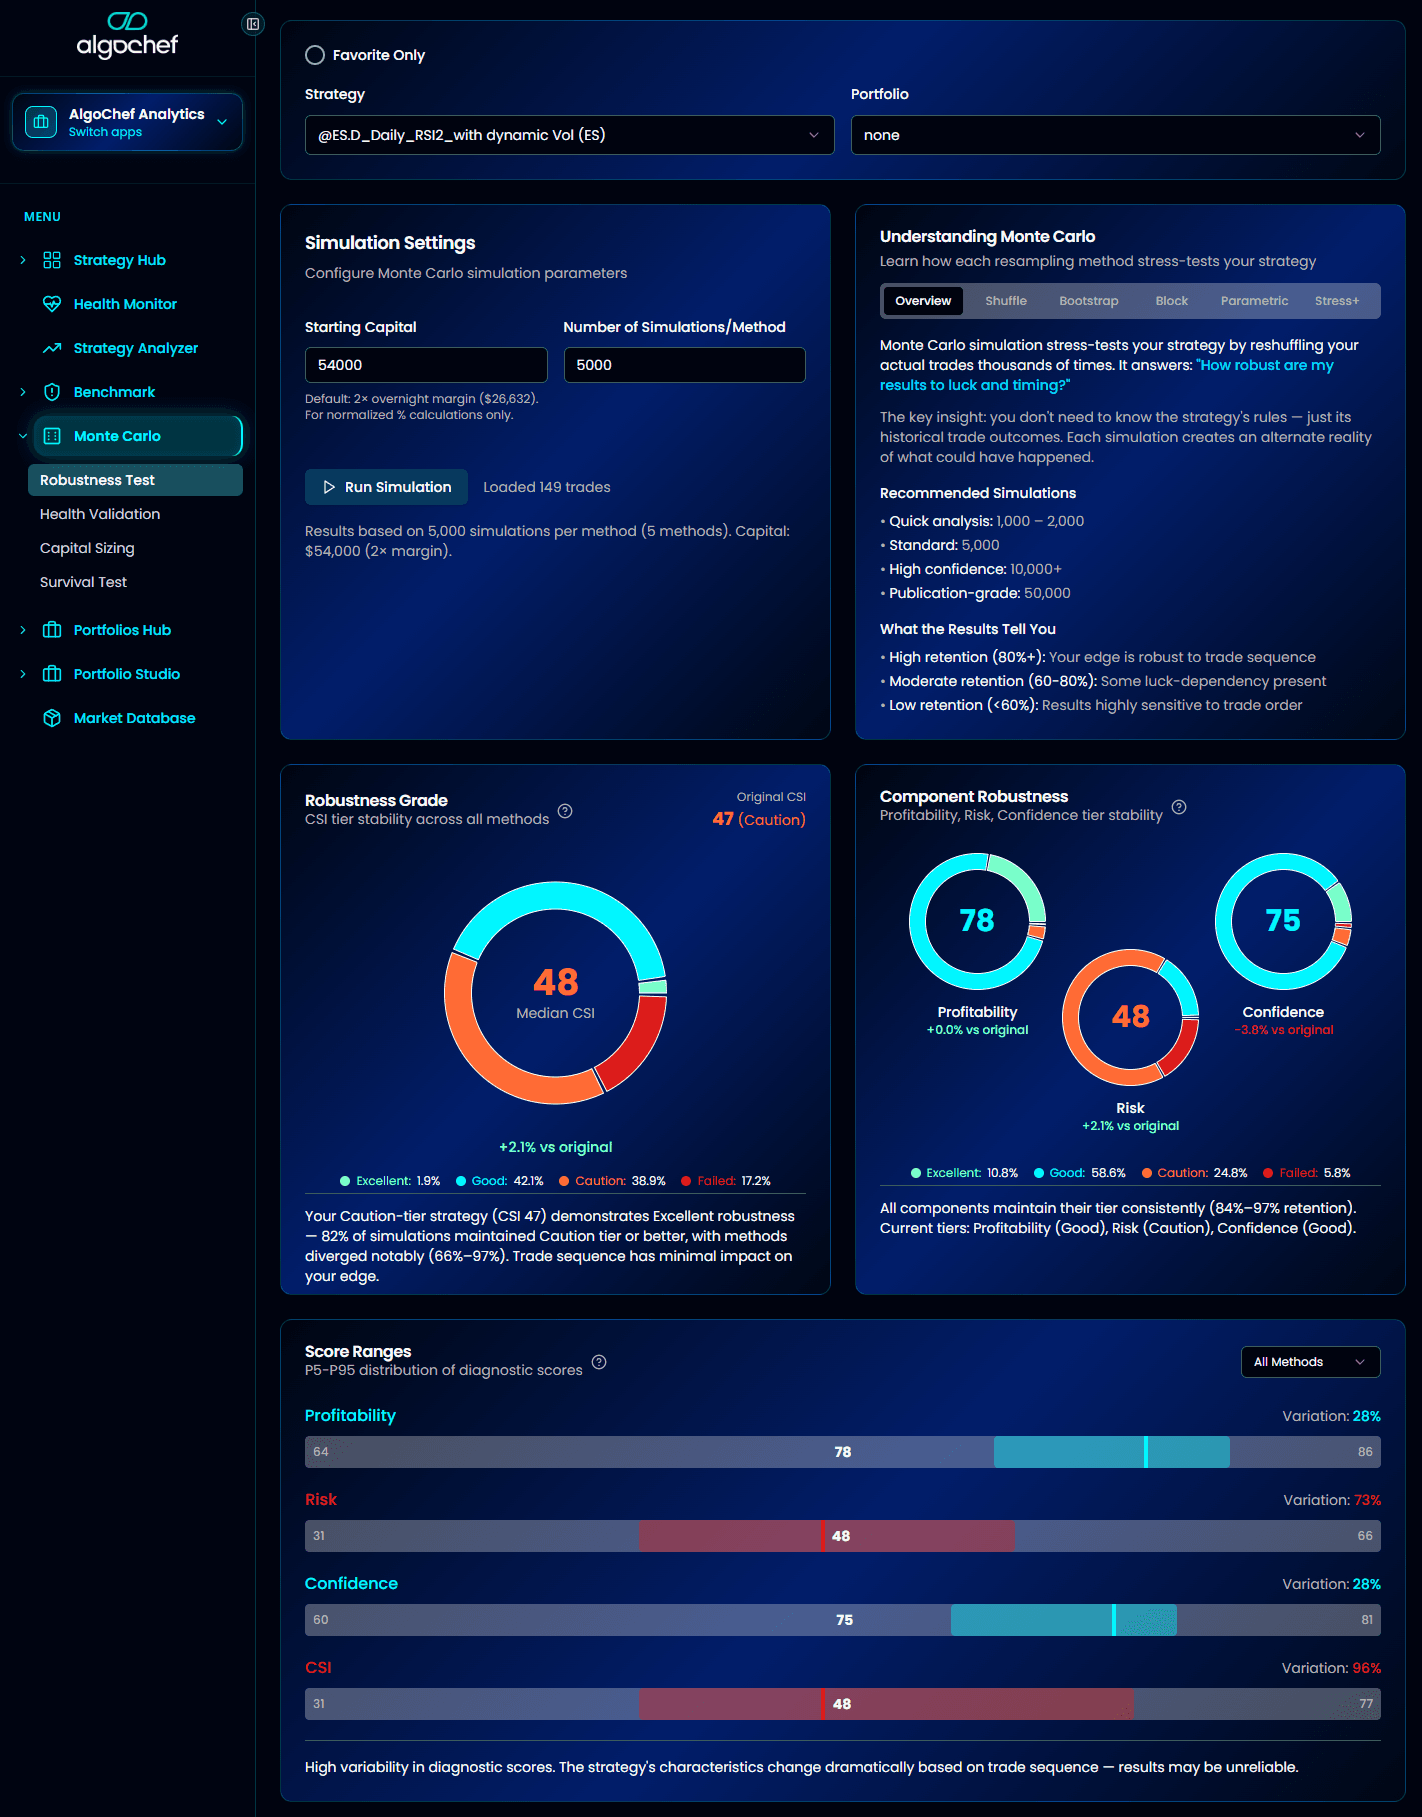
Robustness Test
“Is my edge real or just lucky sequencing?”
Run thousands of simulations across your full trade history. If your strategy only works with trades in the exact order they occurred, it's fragile — and you'll know before risking real money.
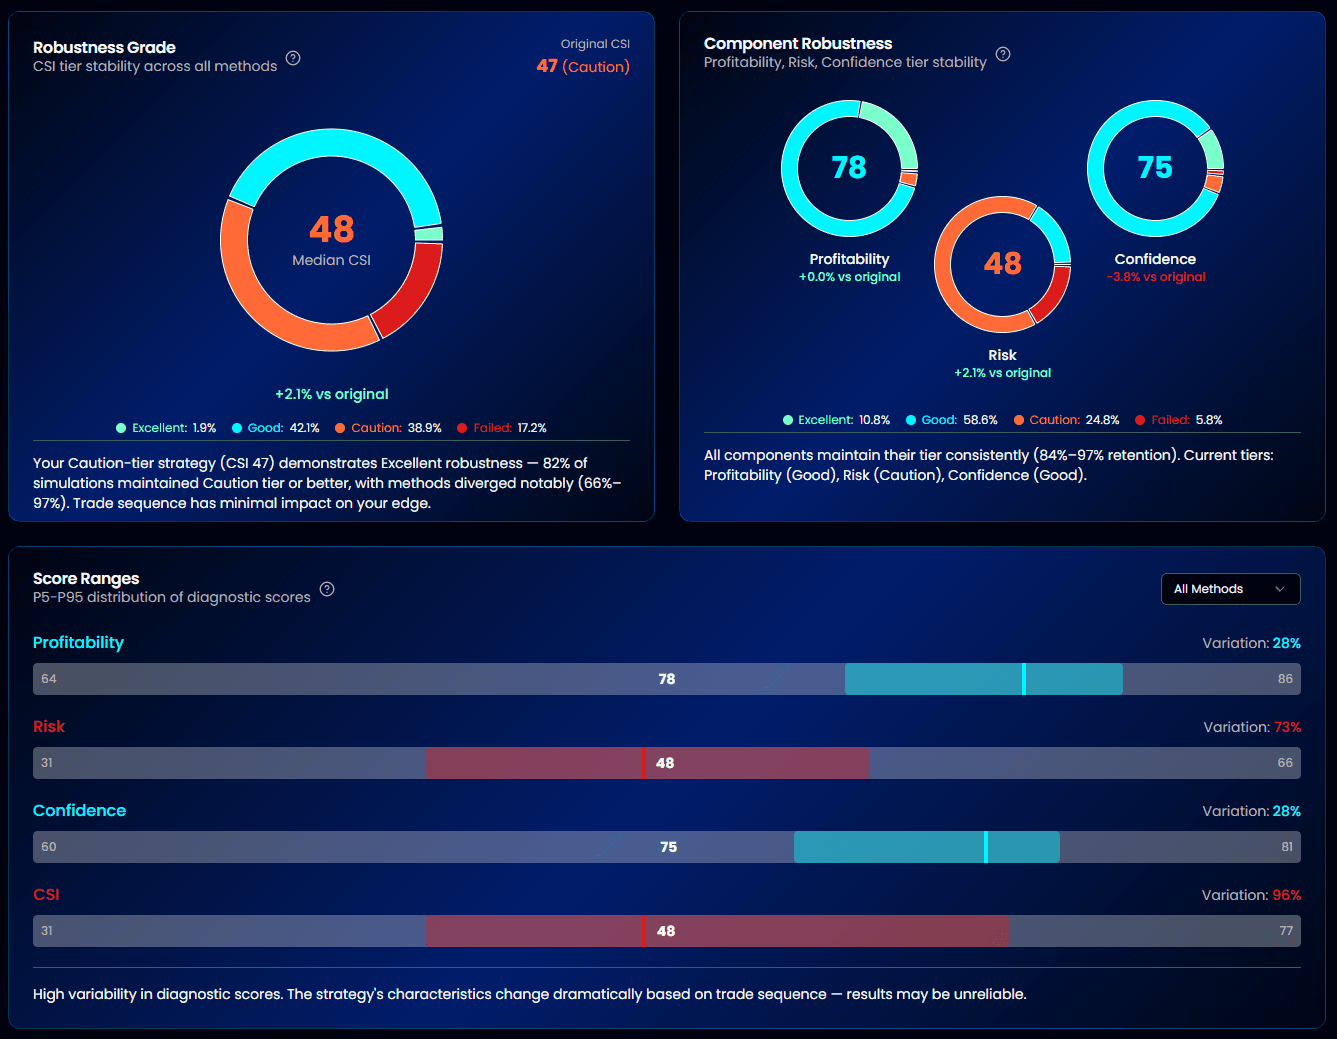
- Robustness Grade: Excellent, Good, Caution, or Failed
- Tier stability % — how often your CSI score holds its tier
- Component breakdown: Profitability, Risk, and Confidence stability
- Equity fan chart showing all simulation paths
- Confidence intervals (50% to 99%) across 20+ metrics
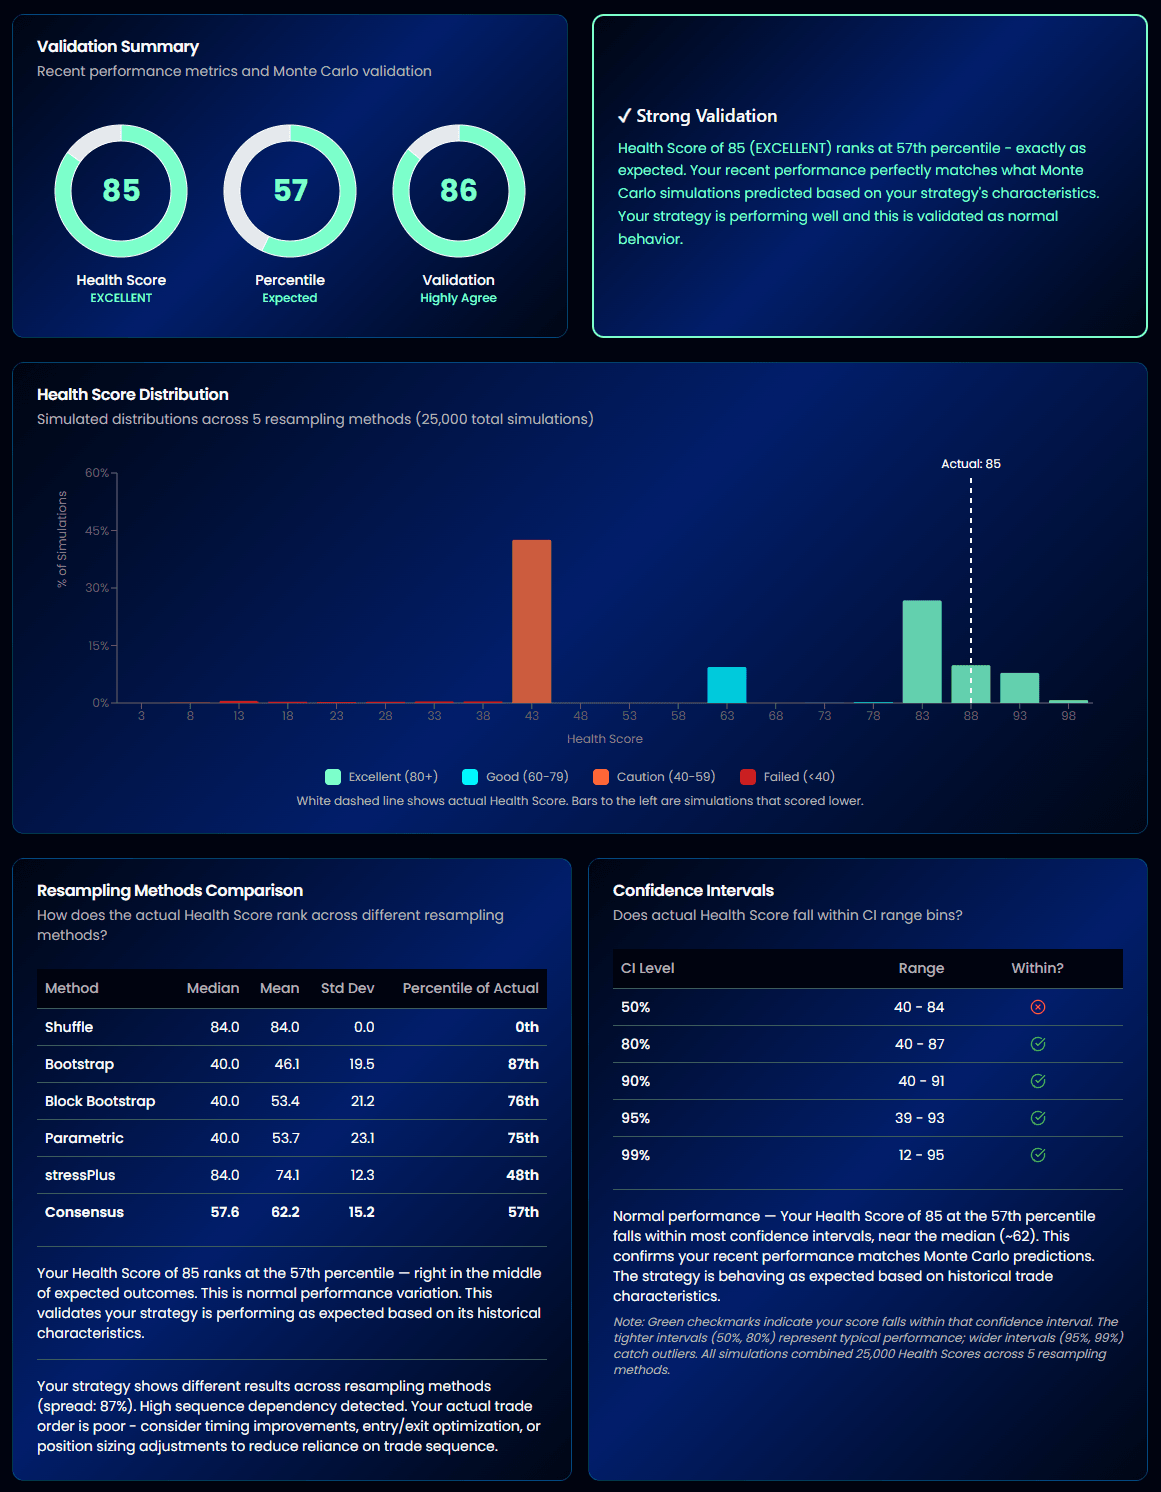
Health Validation
“Does my edge persist out-of-sample?”
Automatically splits your data into in-sample (75%) and out-of-sample (25%), then runs Monte Carlo on each. If the distributions diverge, your strategy may be overfit.
- Automatic 75/25 IS/OOS split
- Health Score validation against Monte Carlo distributions
- Method-by-method distribution histograms
- Divergence quantification between IS and OOS
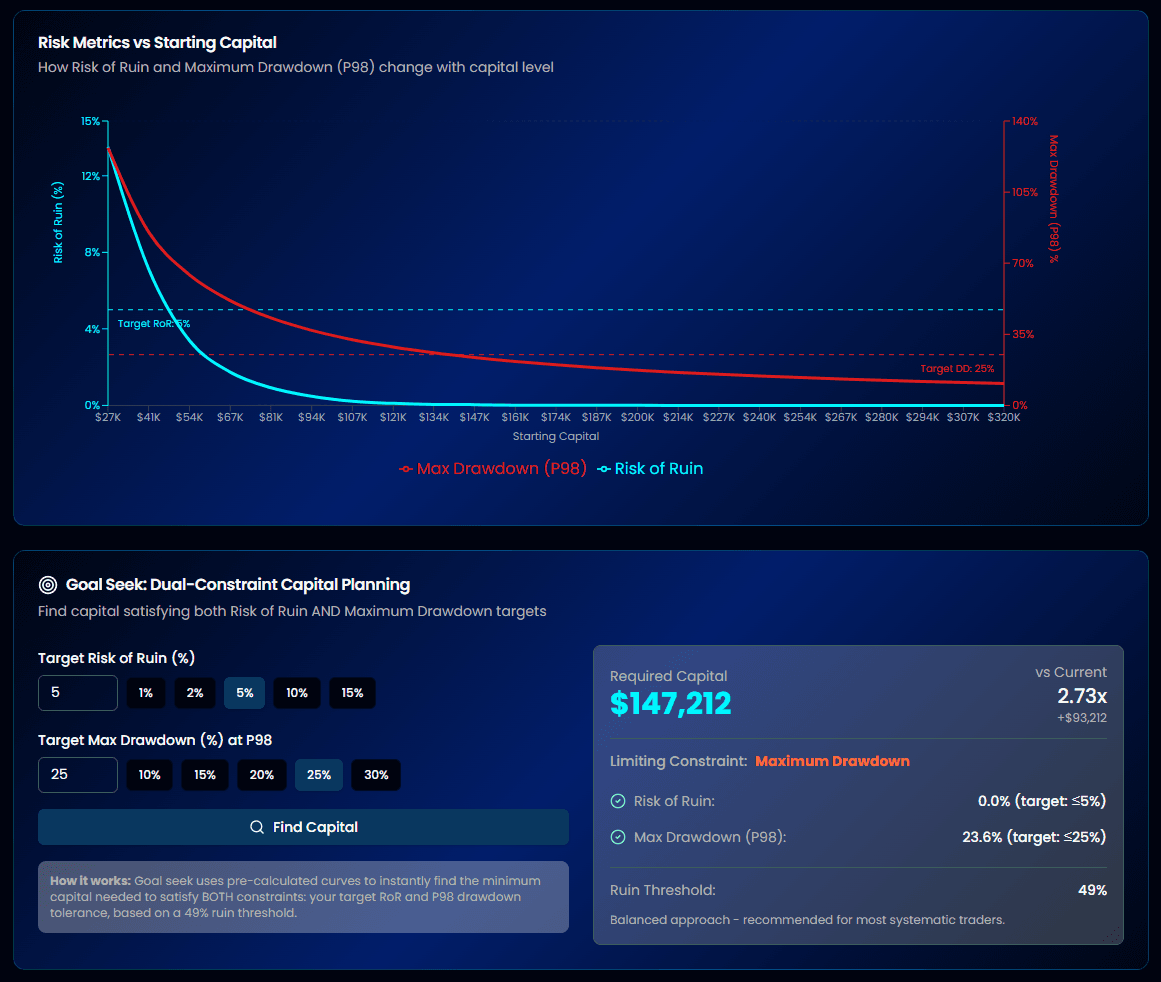
Capital Sizing
“How much capital do I actually need?”
Stop guessing your account size. Capital Sizing uses Monte Carlo simulations to model Risk of Ruin and drawdown probabilities, then tells you exactly how much you need.
- Dual curve chart: Risk of Ruin vs Max Drawdown by capital
- Goal Seek finds your optimal starting capital automatically
- Margin-aware recommendations (auto-detects margin requirements)
- Configurable ruin threshold, drawdown limit, and confidence level
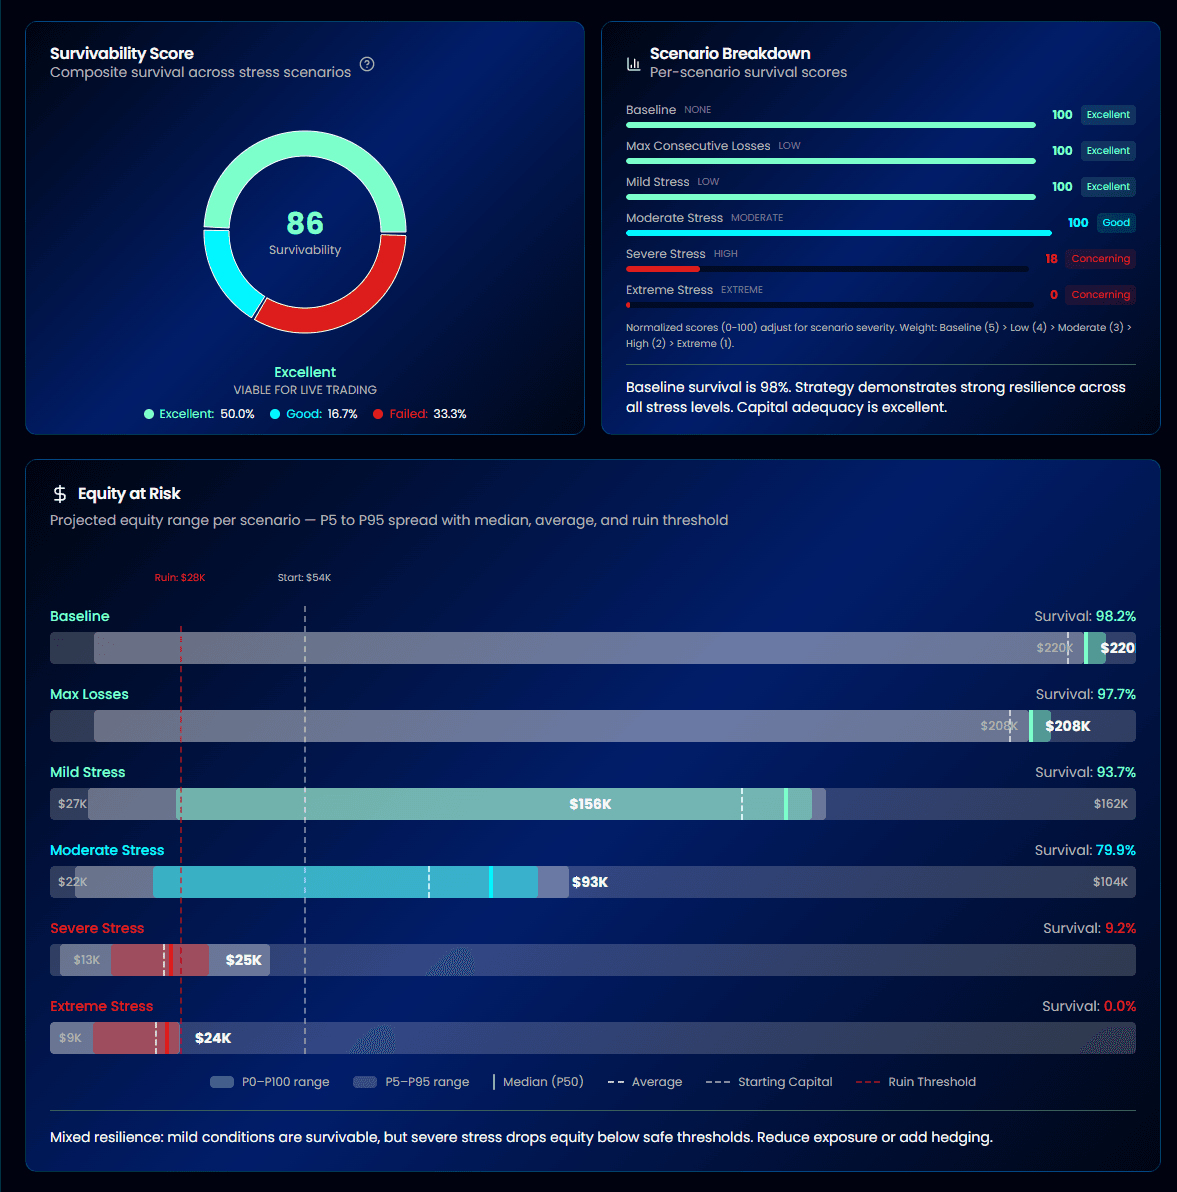
Survival Test
“Will my strategy survive a market crash?”
Six predefined scenarios progressively degrade your win rate, profit size, and loss size. See exactly when your strategy breaks — and whether you have enough capital buffer to survive.
- Survivability Score (0–100) with clear status labels
- 6 scenarios from Baseline to Extreme + max consecutive losses
- Severity-aware survival thresholds
- Per-scenario survival rates and capital adequacy assessment
See the full picture, not just one number
Most Monte Carlo tools give you a single worst-case net profit. AlgoChef recalculates all scoring dimensions across every simulation — showing you where your strategy holds up and where it breaks.
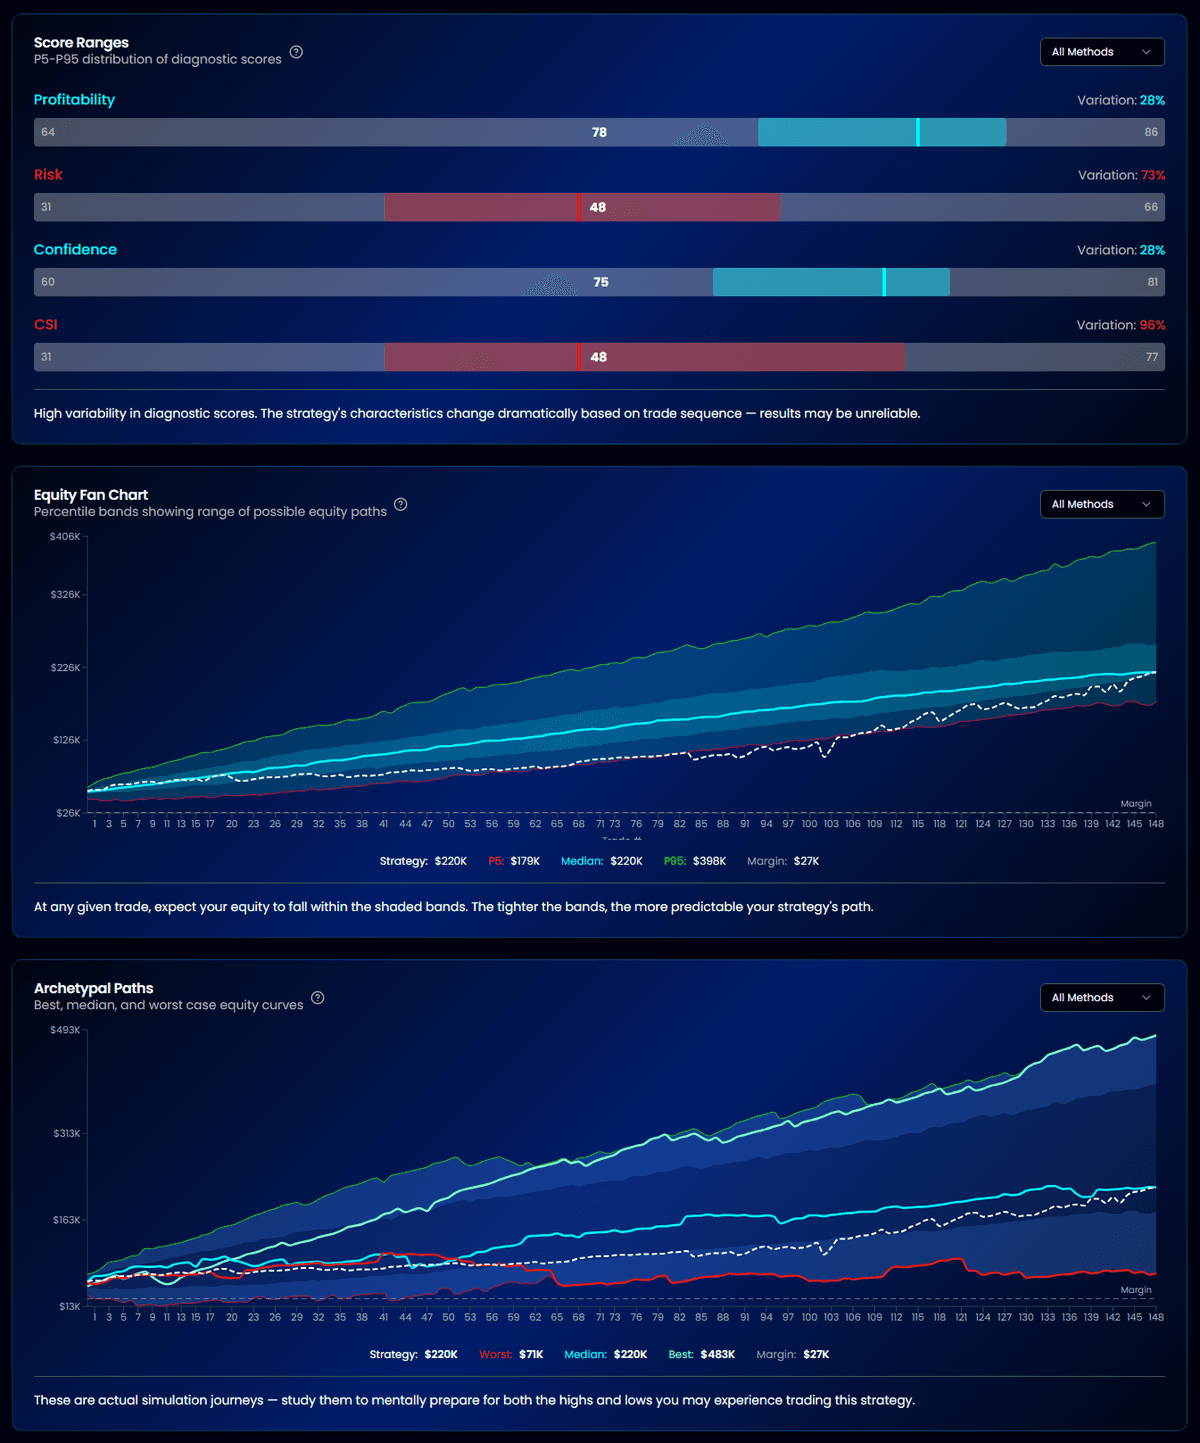
Equity Fan Chart
Percentile bands (P1 through P99) show the range of possible equity paths. A tight fan means robust results. A wide fan means your returns are order-dependent.
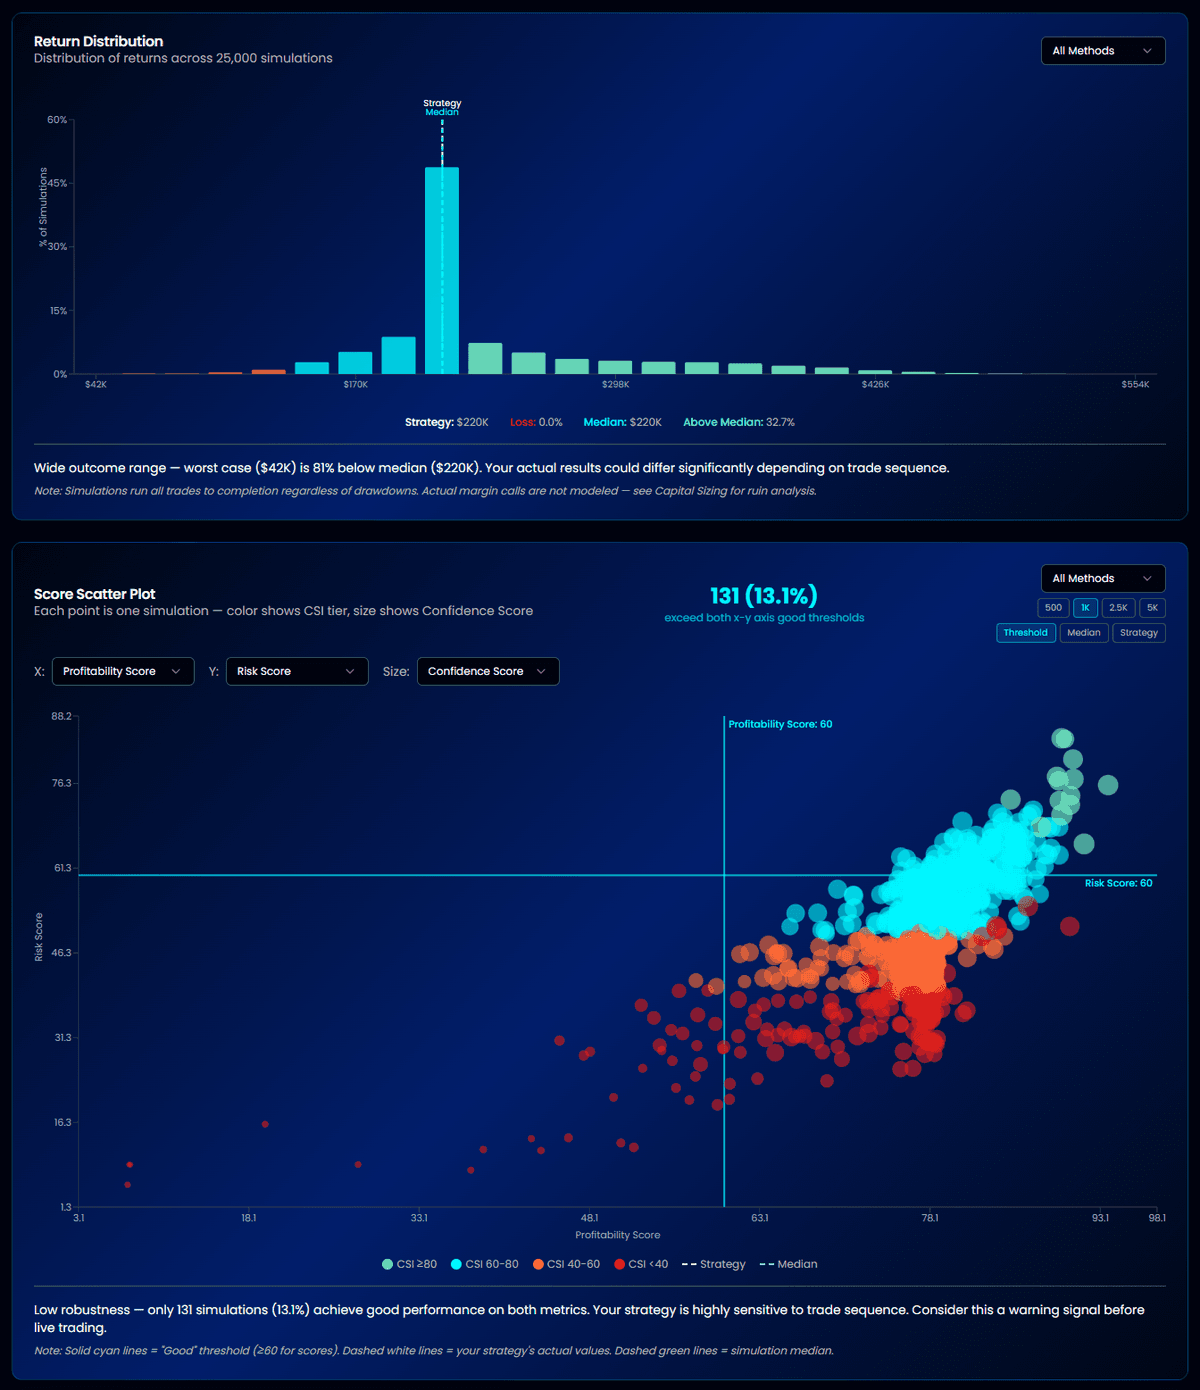
Return Distribution
See how final equity distributes across thousands of simulations. Narrow distributions with high medians indicate a genuine, repeatable edge.
Five simulation methods, five different insights
Each method reveals a different aspect of your strategy's robustness. Use them together for a complete picture.
Shuffle
Fisher-YatesRandomly reorders your trades to test path dependency. If performance changes dramatically, your results depend on lucky sequencing.
Stop guessing.
Start knowing.
Join the waitlist for early access. Validate your strategies with institutional-grade tools.
Trade smarter with institutional tools—no guesswork, no barriers.